
PowerPoint Decks: Complete Guide for Business Success

PowerPoint decks remain the cornerstone of business communication in 2026, serving as critical tools for pitching ideas, securing funding, and driving strategic decisions across industries. Whether you're presenting to investors, stakeholders, or clients, the quality of your PowerPoint decks directly influences how your message is received and acted upon. For financial and tech businesses, where complex data must translate into clear narratives, mastering the art and science of presentation design has become a competitive necessity. This comprehensive guide explores proven strategies for creating impactful powerpoint decks that resonate with your audience and deliver measurable results.
Understanding PowerPoint Decks in the Modern Business Environment
PowerPoint decks have evolved far beyond simple slide collections. They now serve as sophisticated communication instruments that blend data visualization, narrative structure, and visual design to create compelling business cases.
The most effective powerpoint decks function as standalone documents that can be understood without a presenter while simultaneously supporting live presentations. This dual purpose requires careful consideration of both visual hierarchy and content density. Financial institutions and technology companies particularly benefit from this approach, as their decks often circulate among multiple decision-makers before final approvals.
The Strategic Role of Presentation Design
Professional presentation design directly impacts business outcomes. Research indicates that well-designed powerpoint decks increase information retention by up to 65% compared to text-heavy alternatives. For pitch decks seeking investment, design quality correlates with perceived credibility and professionalism.
Key strategic benefits include:
- Enhanced audience comprehension of complex financial data
- Increased engagement during critical presentations
- Stronger brand positioning through consistent visual identity
- Higher conversion rates for sales and investment pitches
- Improved internal alignment on strategic initiatives
Organizations investing in professional PowerPoint design services typically see measurable improvements in presentation effectiveness. The relationship between visual quality and business success has never been clearer.

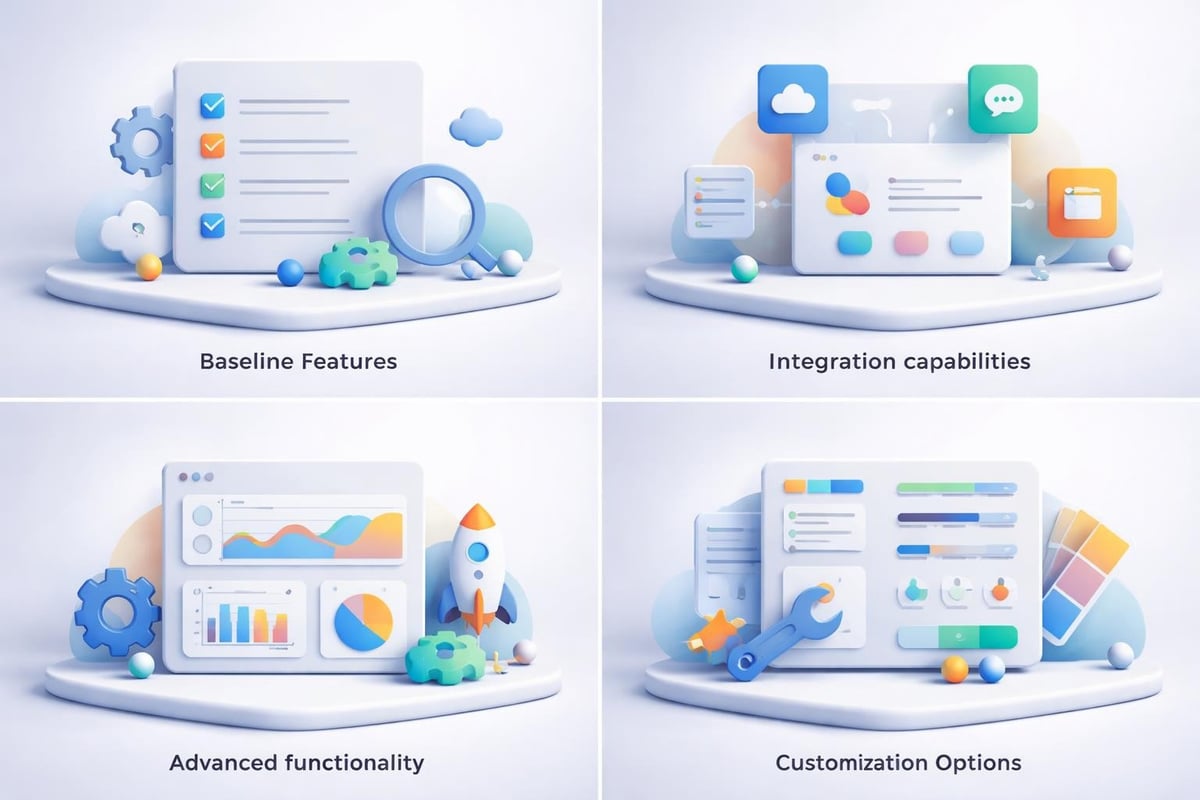
Essential Elements of High-Performing PowerPoint Decks
Creating exceptional powerpoint decks requires mastering several fundamental components. Each element contributes to the overall effectiveness of your presentation, from initial visual impact to final call-to-action.
Narrative Structure and Flow
The backbone of any successful deck is its narrative arc. Financial and tech presentations must guide audiences through complex information while maintaining engagement and building toward clear conclusions.
- Opening Hook: Establish relevance and capture attention within the first 30 seconds
- Problem Definition: Clearly articulate the challenge or opportunity being addressed
- Solution Framework: Present your approach with supporting evidence and data
- Implementation Roadmap: Demonstrate feasibility through realistic timelines and resources
- Expected Outcomes: Quantify benefits and return on investment
Microsoft provides excellent guidance on creating effective presentations that covers both content structure and delivery techniques. The principles outlined apply across industries but prove particularly valuable for data-driven sectors.
Visual Hierarchy and Information Architecture
Visual hierarchy determines how audiences process information on each slide. Effective powerpoint decks use size, color, contrast, and positioning to guide viewer attention strategically.
| Design Element | Primary Function | Best Practice |
|---|---|---|
| Typography | Information hierarchy | Use maximum 2-3 font families, vary size for emphasis |
| Color Palette | Brand consistency, emphasis | Limit to 4-5 colors, ensure accessibility contrast |
| White Space | Reduce cognitive load | Maintain 30-40% empty space per slide |
| Alignment | Professional polish | Use grid systems, consistent margins |
The University of Waterloo's presentation best practices emphasize avoiding premade templates in favor of custom designs that reflect brand identity. This approach proves especially important for financial services and technology companies where differentiation matters.
Data Visualization Excellence
Financial and tech powerpoint decks typically contain substantial quantitative information. Transforming raw data into meaningful visual insights separates mediocre presentations from exceptional ones.
Effective data visualization techniques:
- Select chart types that match your data story (trends, comparisons, distributions)
- Simplify complex datasets by focusing on key metrics
- Use annotations to highlight critical insights
- Maintain consistency in chart styling across slides
- Integrate brand colors meaningfully rather than decoratively
Creating compelling pitch decks for cybersecurity or fintech presentations demands particular attention to data security visualization and financial metrics presentation.
Design Principles That Elevate PowerPoint Decks
Superior presentation design follows established principles while adapting to specific business contexts. Understanding these fundamentals enables teams to create powerpoint decks that stand apart from generic corporate slides.
Consistency Versus Monotony
Consistency builds professional credibility, but excessive uniformity creates visual fatigue. The solution lies in establishing design systems that allow controlled variation.
Develop a master slide template that defines typography, color usage, spacing standards, and layout grids. Within this framework, create 5-7 distinct slide layouts for different content types: title slides, content slides, data visualization slides, image-focused slides, and section dividers.
ODU's presentation guidelines stress the importance of consistent slide layouts and font choices for enhanced readability. This consistency becomes your visual language, allowing audiences to focus on content rather than decoding new layouts on each slide.
Typography That Communicates Authority
Font selection directly impacts perceived credibility. Financial and technology businesses should prioritize clarity and professionalism over trendy or decorative typefaces.
Sans-serif fonts like Helvetica, Montserrat, or Proxima Nova work well for body text and data labels. For headlines, consider slightly more distinctive options that still maintain readability at distance. Avoid using more than two font families per deck.
Typography specifications for business decks:
- Headline text: 32-44 points minimum
- Body text: 18-24 points minimum
- Data labels: 14-16 points minimum
- Never use all caps for body text (reduces readability by 13%)

Color Psychology and Brand Alignment
Color choices in powerpoint decks convey meaning beyond aesthetics. Financial presentations often employ blues and greens to signal trust and growth, while technology decks might incorporate more dynamic palettes suggesting innovation.
Your primary brand color should appear strategically rather than overwhelmingly. Use it for key data points, call-to-action elements, and strategic emphasis. Secondary colors support categorization and visual interest without competing for attention.
High Point University offers valuable accessibility best practices that include color contrast requirements. Ensuring your decks meet WCAG 2.1 AA standards (4.5:1 contrast ratio for normal text) expands audience reach and demonstrates inclusive design thinking.
Content Development Strategies for Business Decks
Beyond visual design, content quality determines whether powerpoint decks achieve their objectives. Strategic content development balances comprehensive information with audience attention spans.
The One Idea Per Slide Principle
Cognitive science research confirms that audiences process information most effectively when each slide focuses on a single core concept. This doesn't mean slides must be sparse, but rather that all elements should support one clear message.
For complex topics requiring multiple data points, consider whether information belongs on one slide or deserves sequential revelation across multiple slides. Financial analysis particularly benefits from this approach, where breaking down complex models into digestible components improves comprehension.
Writing for Scanability
Even in presentation settings, audiences scan before they read. Structure your powerpoint decks to reward scanning behavior while supporting deeper engagement for interested parties.
Use bullet points strategically rather than excessively. Each bullet should represent a complete thought, not sentence fragments. Lead with conclusions rather than building toward them, as business audiences prefer bottom-line-up-front communication.
Content hierarchy guidelines:
- Slide headline states the conclusion or key point
- Supporting bullets provide evidence or context
- Visual elements reinforce the central message
- Source citations build credibility without cluttering
When developing content for the best PPT presentations, remember that clarity trumps comprehensiveness. Your deck should prompt conversation, not replace it.
Advanced Techniques for Financial and Tech Presentations
Specialized industries require specialized approaches. Financial services and technology companies face unique presentation challenges that demand tailored solutions.
Presenting Complex Financial Data
Financial powerpoint decks must balance regulatory precision with audience accessibility. The challenge lies in maintaining technical accuracy while avoiding overwhelming viewers with numbers.
| Data Type | Visualization Approach | Key Considerations |
|---|---|---|
| Time series trends | Line charts with annotations | Highlight inflection points, use reference lines |
| Performance comparisons | Bar charts or waterfall diagrams | Consistent baseline, clear labeling |
| Portfolio allocations | Pie charts or treemaps | Limit to 5-7 segments maximum |
| Scenario analysis | Side-by-side comparison tables | Use color coding for quick comprehension |
Consider creating appendix slides with detailed supporting data. This approach keeps main decks focused while providing backup materials for detailed questions. Reference these appendix slides in your main deck so audiences know additional depth exists.
Technology Solution Demonstrations
Tech companies presenting product capabilities or platform features face different challenges. Powerpoint decks must convey functionality without becoming instruction manuals.
Screenshots and interface mockups work effectively when cropped to show relevant features rather than entire screens. Annotate images to direct attention and explain functionality. Use progressive disclosure, showing baseline capabilities first, then building toward advanced features.
For software demonstrations, consider embedding short video clips (15-30 seconds maximum) that show actual functionality. This provides tangible proof while maintaining presentation flow. TechRadar's presentation software review explores tools beyond PowerPoint that might better serve specific tech demonstration needs.
Optimizing PowerPoint Decks for Different Presentation Contexts
Effective powerpoint decks adapt to their delivery context. Investor pitches require different approaches than internal strategy presentations or client proposals.
Investor Pitch Decks
Venture capital and private equity presentations demand extreme focus. Investors typically allocate 3-5 minutes for initial pitch review, meaning your deck must communicate value proposition, market opportunity, competitive advantage, and financial projections rapidly.
Limit investor decks to 10-15 slides maximum. Each slide should pass the "glance test," communicating its core message in under three seconds. Front-load critical information, as many investors never reach final slides.
Essential investor deck slides:
- Problem definition with market quantification
- Solution overview and unique value proposition
- Business model and revenue strategy
- Market opportunity and competitive landscape
- Traction metrics and growth trajectory
- Team credentials and relevant experience
- Financial projections and funding requirements
Exploring examples of successful fintech pitch decks reveals patterns in structure, data presentation, and visual design that resonate with financial investors.
Internal Strategy Presentations
Executive team and board presentations allow greater depth than investor pitches. These powerpoint decks typically run 20-40 slides and include more detailed analysis, supporting data, and implementation considerations.
Internal audiences expect comprehensive backup for recommendations. Include methodology explanations, data sources, assumption documentation, and risk assessments. These elements build confidence in strategic recommendations.
However, maintaining visual engagement remains critical. Even internal stakeholders lose focus with text-heavy slides. Apply the same design principles while expanding content scope.
Client Proposals and Sales Decks
Sales presentations require yet another approach. These powerpoint decks must balance education, persuasion, and relationship building. Unlike investor pitches focused on opportunity, sales decks emphasize client-specific value.
Customize each sales deck for the specific prospect. Generic presentations signal lack of investment in the relationship. Reference the client's stated challenges, incorporate their industry data, and demonstrate understanding of their specific context.
Structure sales decks around the client's journey: current state challenges, desired future state, your solution's role in that transformation, implementation pathway, and expected outcomes. This client-centric approach proves more effective than product-focused presentations.
Quality Assurance and Refinement Processes
Professional powerpoint decks require rigorous review before presentation. Quality assurance processes catch errors, improve clarity, and ensure consistency.
Multi-Layer Review Approach
Implement a three-tier review process: content accuracy, design consistency, and presentation readiness.
Content review checklist:
- Verify all data points against source materials
- Confirm mathematical calculations and projections
- Check that conclusions align with supporting evidence
- Ensure industry terminology accuracy
- Validate compliance with regulatory requirements
Design review checklist:
- Confirm consistent font usage across all slides
- Verify color palette adherence to brand guidelines
- Check alignment using grid overlays
- Ensure image resolution meets projection standards (minimum 150 DPI)
- Test animation timing and transitions
Presentation readiness:
- Review slide order for logical flow
- Test embedded media on presentation equipment
- Create backup PDF version for compatibility
- Prepare speaker notes for complex slides
- Rehearse with actual slides to verify timing
Organizations can explore minimal PowerPoint templates as starting points, but professional refinement separates adequate from exceptional.
Accessibility Considerations
Accessible powerpoint decks reach wider audiences and demonstrate inclusive thinking. Beyond ethical considerations, accessibility improves overall design quality by enforcing clarity and structure.
Ensure sufficient color contrast for text readability. Add alt text to images and charts so screen readers can convey information to visually impaired users. Structure content hierarchically using proper heading styles rather than just size variations.
Consider providing transcript documents alongside decks for audiences who may review materials asynchronously. This accommodation benefits multiple audience segments while improving content discoverability.
Emerging Trends Shaping PowerPoint Deck Evolution
Presentation design continues evolving as technology advances and audience expectations shift. Understanding emerging trends helps future-proof your powerpoint decks while maintaining current relevance.
AI-Assisted Design and Content
Artificial intelligence tools increasingly support presentation creation, from automated layout suggestions to content generation. Recent research, including PPTBench evaluations, examines how large language models understand PowerPoint layout and design principles.
While AI assistance accelerates certain tasks, human judgment remains essential for strategic messaging, brand alignment, and audience adaptation. The most effective approach combines AI efficiency with human expertise. Tools can handle repetitive formatting while designers focus on visual storytelling and message refinement.
PPTArena benchmarking for agentic PowerPoint editing demonstrates growing capabilities in slide modification through natural language instructions. These advances suggest future workflows where designers iterate through conversational interfaces rather than manual adjustments.
Interactive and Non-Linear Presentations
Traditional linear powerpoint decks assume sequential slide progression. Emerging approaches embrace non-linear navigation, allowing presenters to adapt real-time based on audience interest and questions.
Implement this through hyperlinked navigation slides, enabling jumps to relevant sections based on discussion flow. Create modular content blocks that work independently, allowing flexible sequencing. This approach particularly benefits technical presentations where audience expertise varies significantly.
Integration with Collaborative Platforms
PowerPoint decks increasingly exist within broader collaboration ecosystems rather than standalone files. Integration with project management tools, CRM systems, and content libraries enables version control, usage tracking, and content reusability.
Financial services firms particularly benefit from centralized slide libraries with approved messaging, compliant disclosures, and current data visualizations. This infrastructure ensures consistency while accelerating deck creation for client-facing teams.
Measuring PowerPoint Deck Effectiveness
Creating exceptional powerpoint decks requires understanding what success looks like. Establish metrics that connect presentation quality to business outcomes.
Quantitative Performance Indicators
Different presentation contexts demand different success metrics. Investor pitch decks succeed when they advance to subsequent funding rounds. Sales presentations achieve goals through conversion rates and deal velocity. Internal strategy decks prove effective through implementation approval and resource allocation.
Measurable indicators include:
- Presentation-to-meeting ratio (how often decks lead to follow-up meetings)
- Time-to-decision after presentation delivery
- Stakeholder engagement during presentations (questions asked, discussion depth)
- Content recall in follow-up conversations
- Actual outcomes versus presented recommendations
Track these metrics over time to identify patterns correlating design choices with business results. This data-driven approach to presentation design enables continuous improvement.
Qualitative Feedback Integration
Beyond numbers, qualitative feedback reveals opportunities for enhancement. Conduct brief post-presentation surveys with key stakeholders to gather impressions on clarity, persuasiveness, and visual quality.
Ask specific questions about which slides resonated most strongly, where confusion occurred, and what additional information would have been valuable. This feedback directly informs future deck development.
Consider A/B testing different approaches for recurring presentation types. Try alternative data visualizations, narrative structures, or design treatments, then compare audience responses. This experimental mindset drives innovation in presentation effectiveness.
Mastering powerpoint decks requires balancing strategic thinking, design excellence, and audience understanding to transform complex business information into compelling visual narratives. Whether you're pitching to investors, presenting to executives, or proposing solutions to clients, the quality of your presentation directly influences outcomes. Prznt Perfect specializes in creating visually stunning and impactful presentations for financial and tech businesses, transforming complex data into clear, actionable narratives that resonate with your target audience. Ready to elevate your presentation game? Partner with experts who understand the intersection of design, strategy, and business communication.


- This is some text inside of a div block.lay out the facts clearly and compellingly. Use data to establish the ground reality, but remember that facts alone are like the individual strands of a tapestry—necessary but not complete.lay out the facts clearly and compellingly. Use data to establish the ground reality, but remember that facts alone are like the individual strands of a tapestry—necessary but not complete.
- This is some text inside of a div block.lay out the facts clearly and compellingly. Use data to establish the ground reality, but remember that facts alone are like the individual strands of a tapestry—necessary but not complete.

