

Challenge
What does it take for a project coordinator to wrap months, even years, of academic research into one clear, visually appealing picture? Overwhelming amounts of data and text, many stakeholders, and inconsistent visuals made by the academics themselves. When the project is being presented for an EU grant, the stakes for the infographic are even higher.
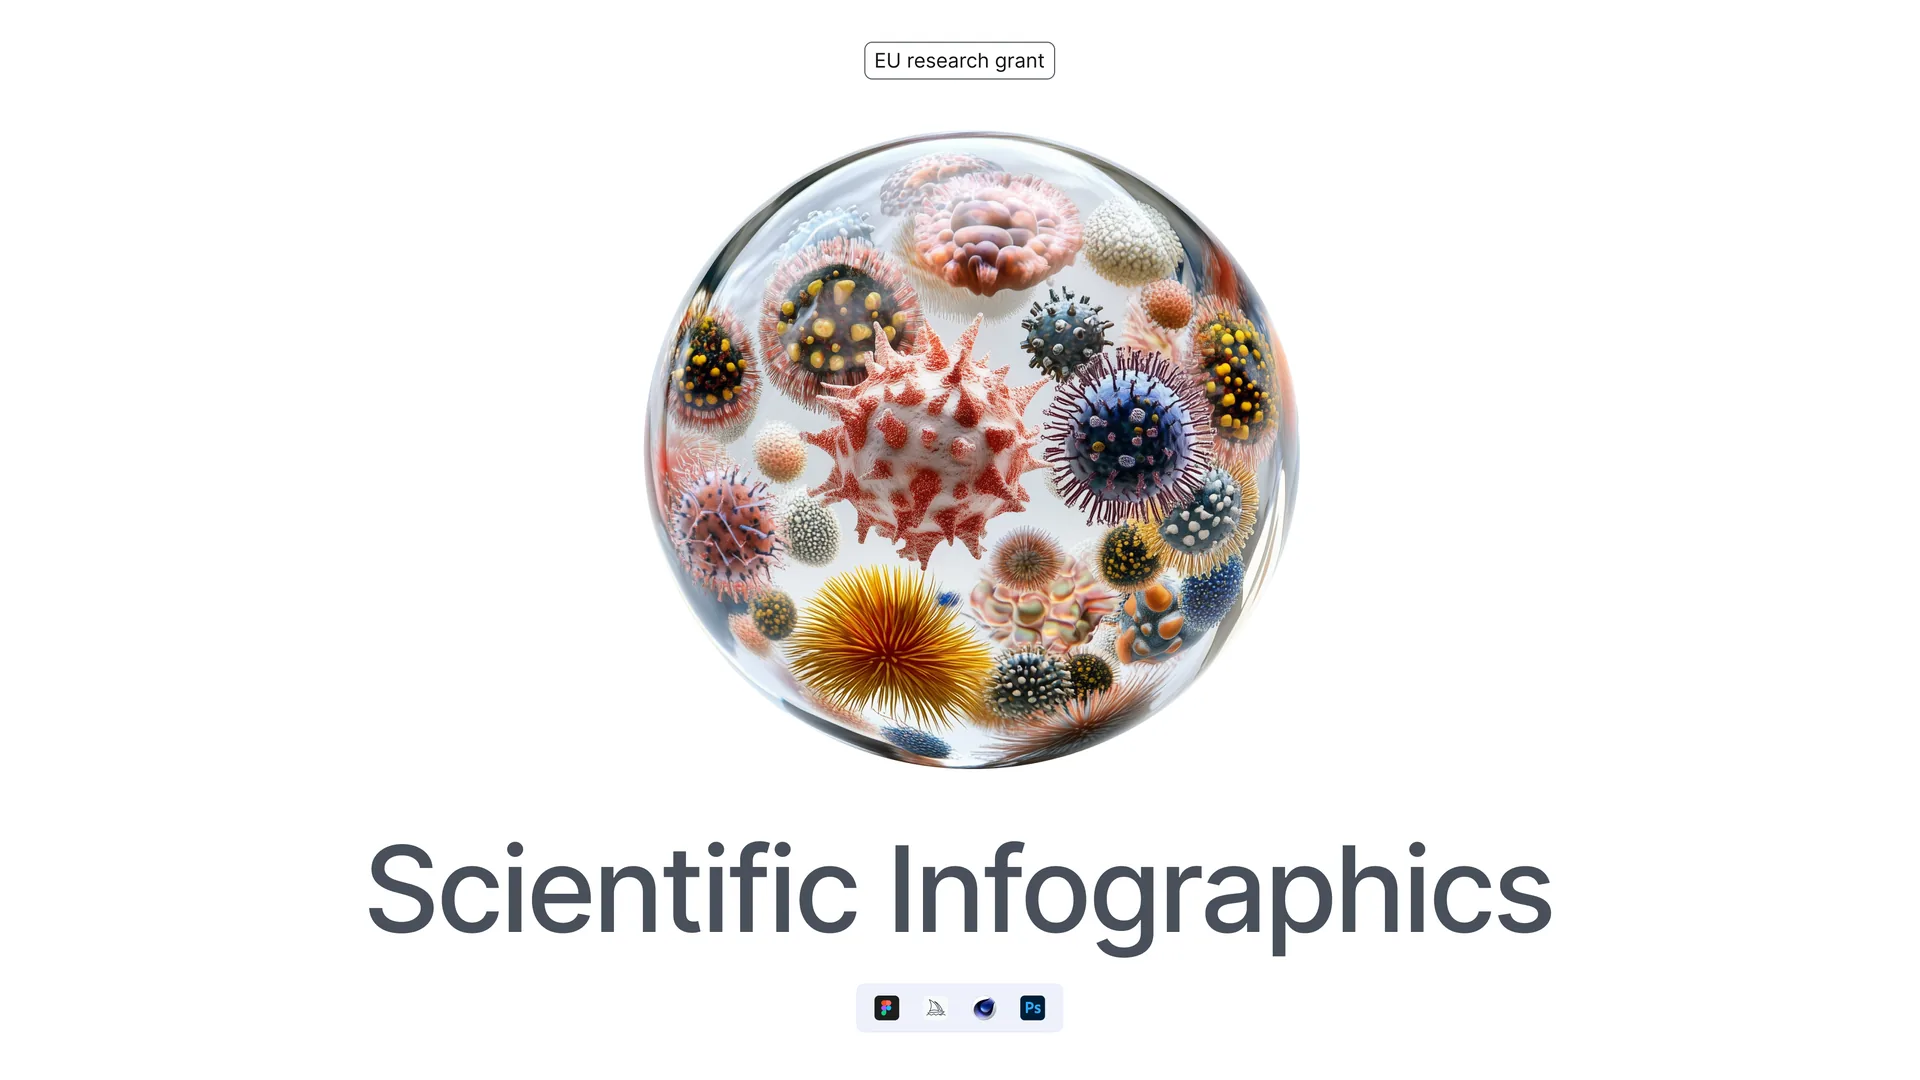
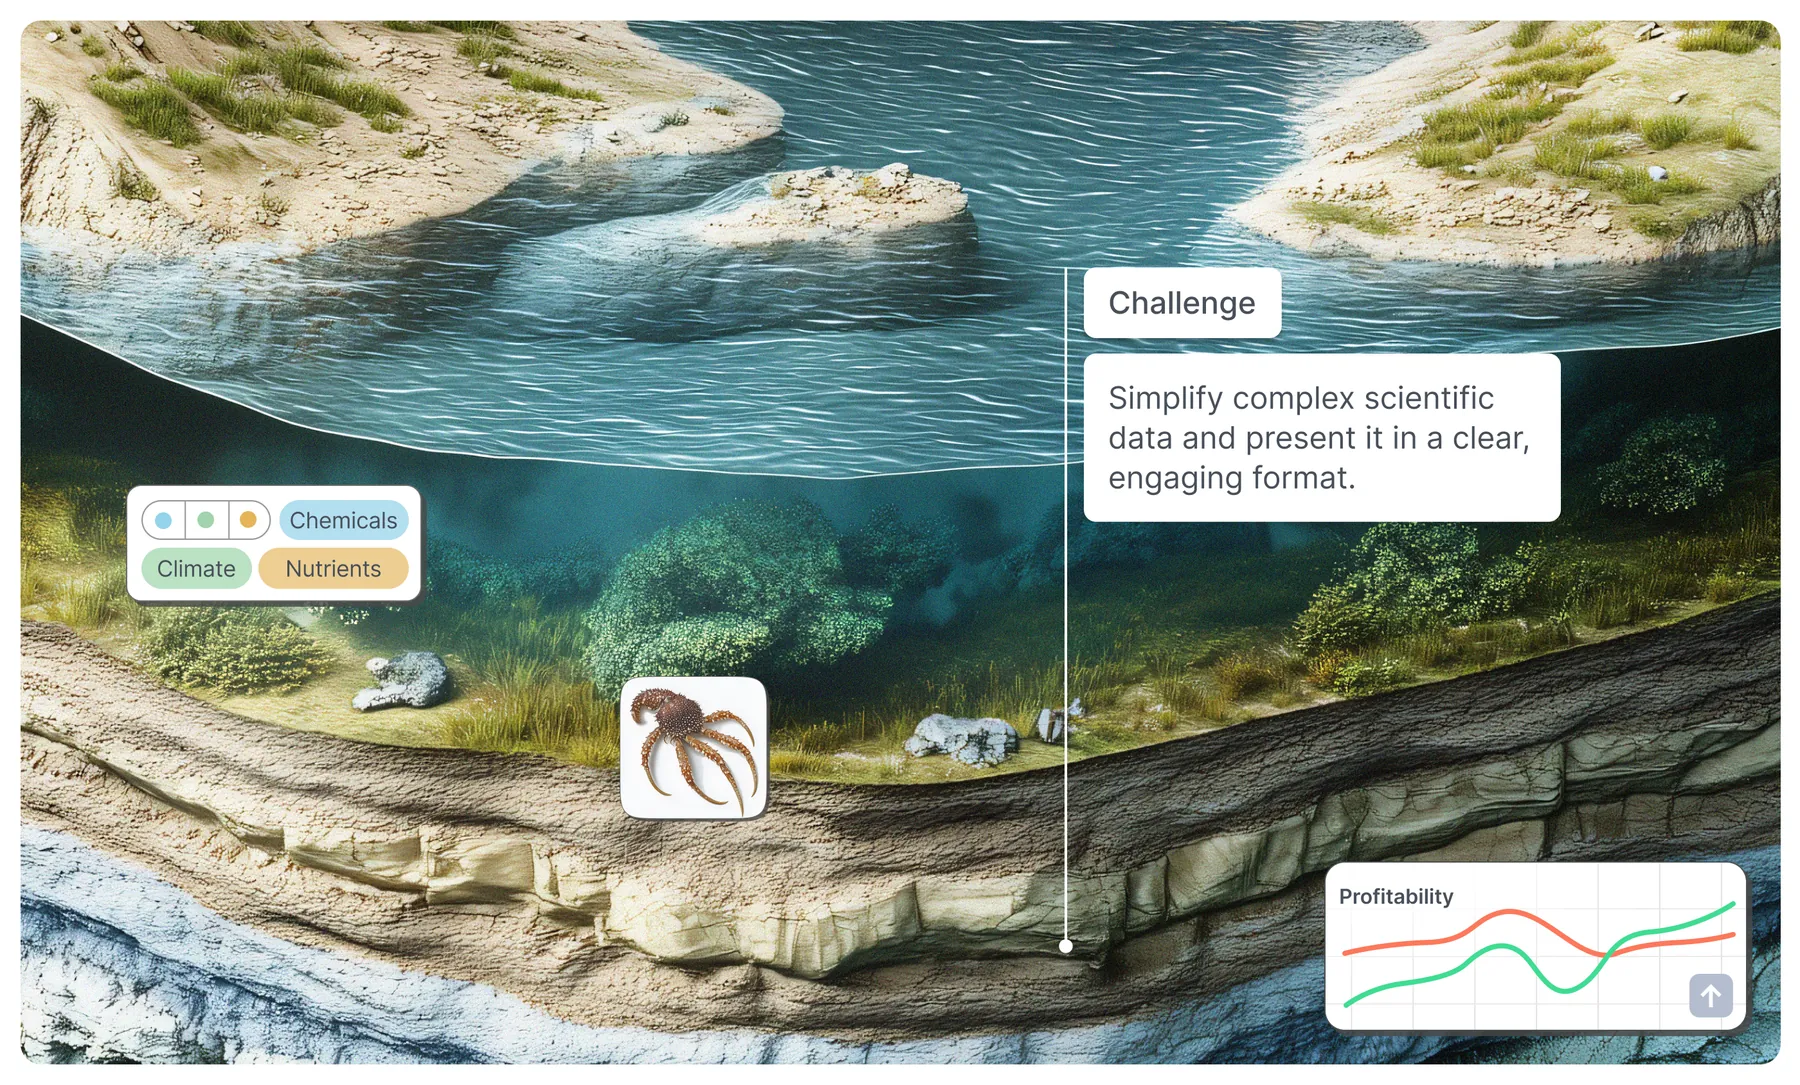
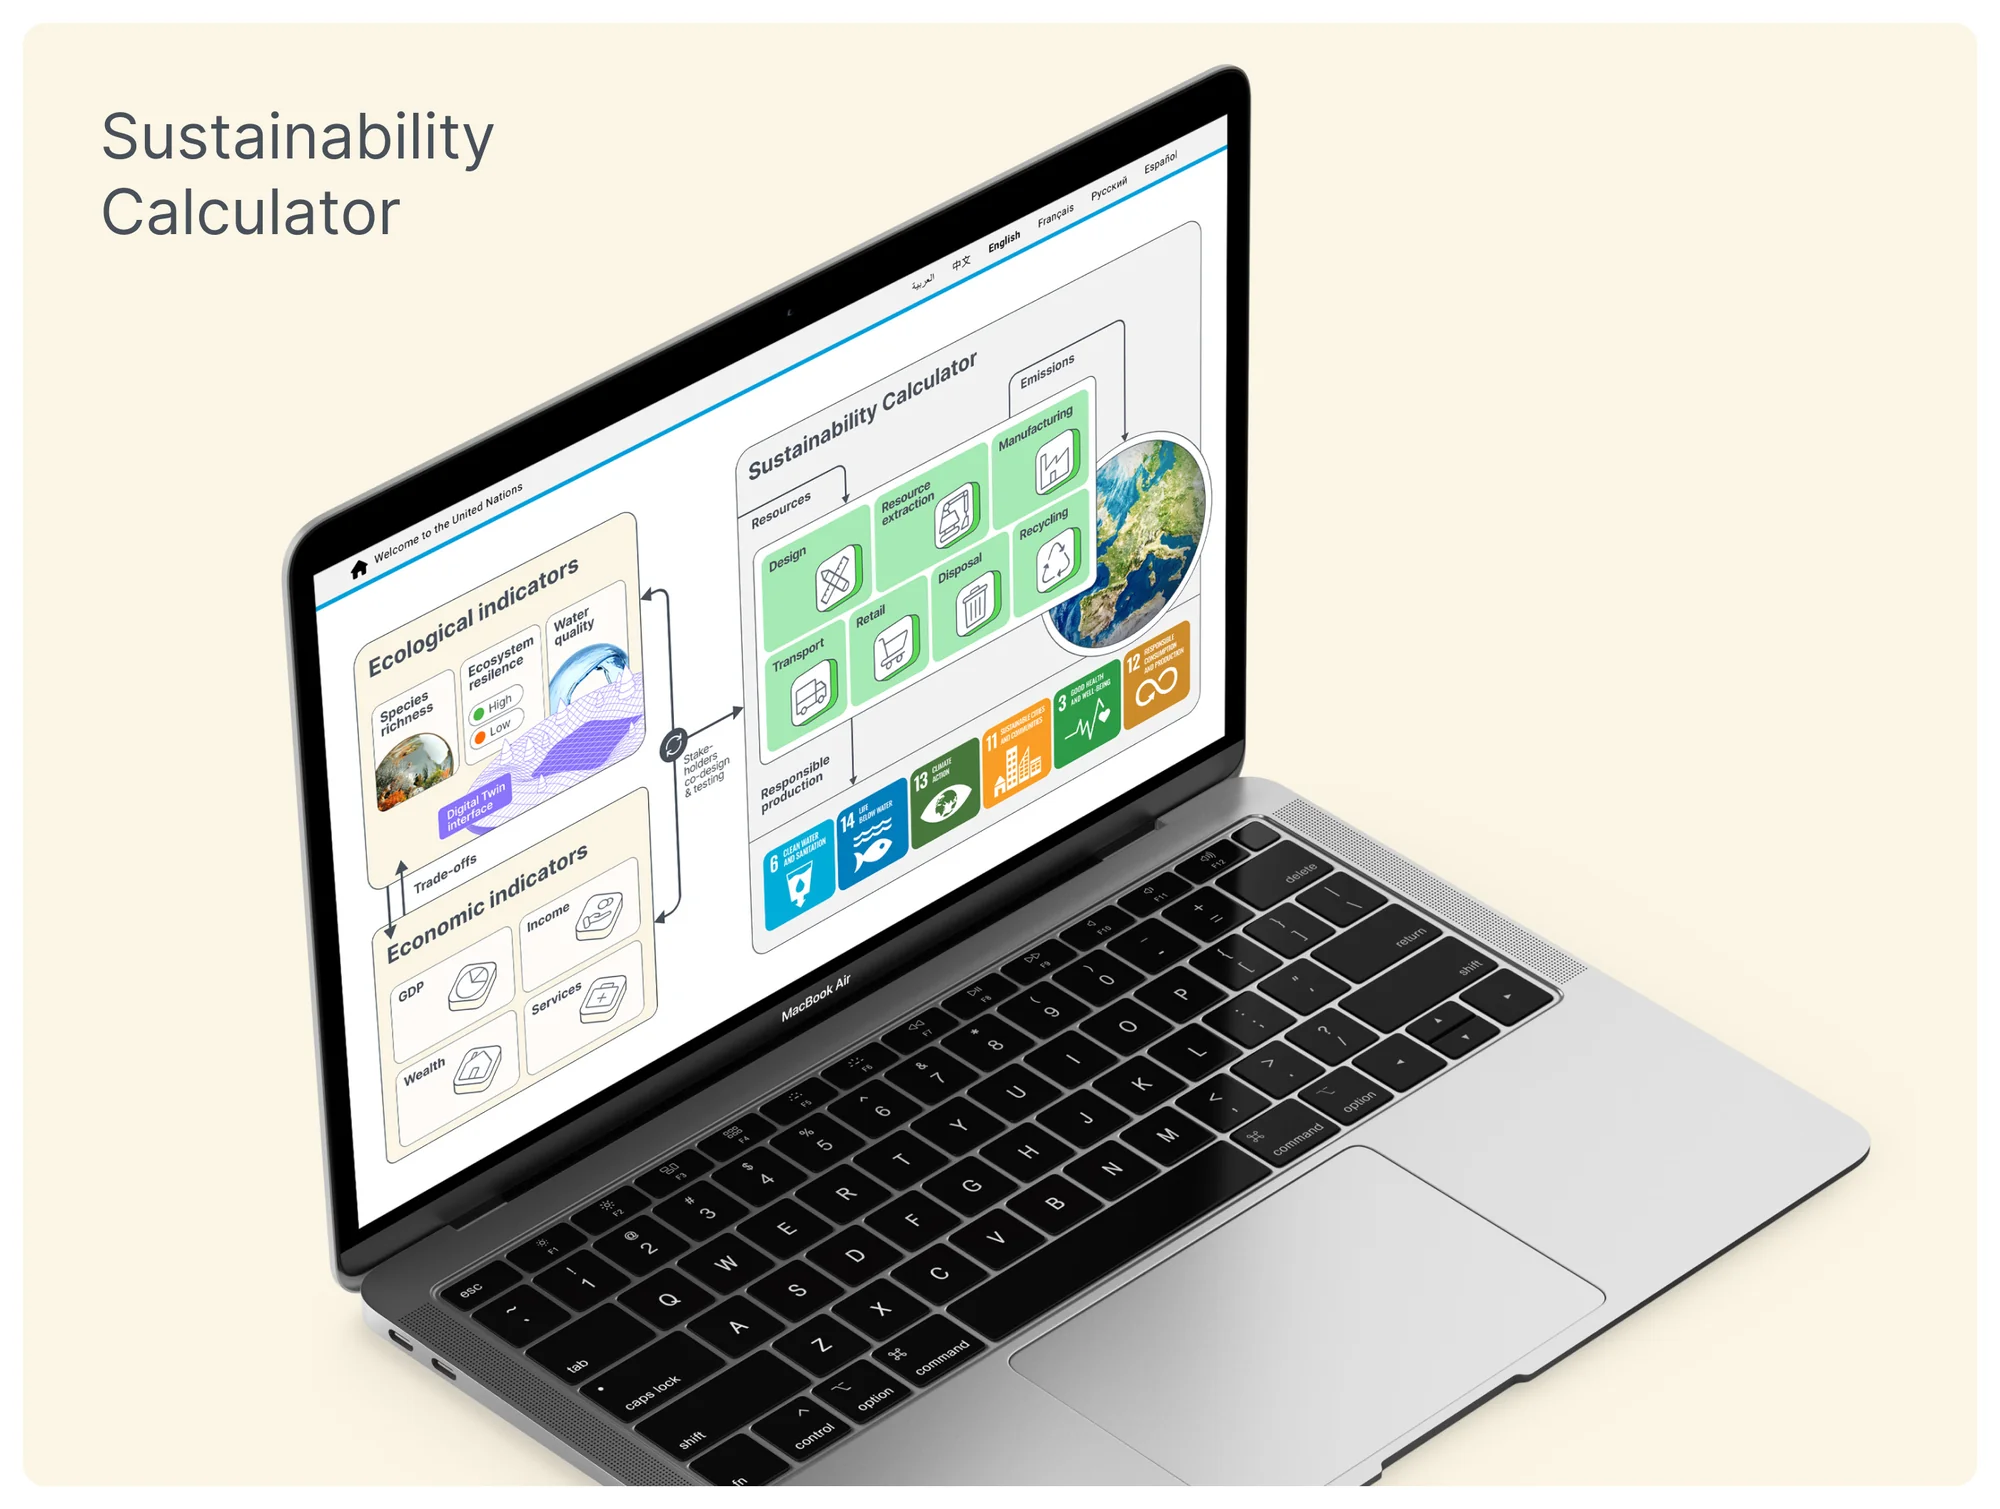
For a pan-European initiative on biodiversity and lake ecosystem management, we designed a presentation and a set of posters with scientific illustrations that turn complex data into clear, detailed insights without oversimplifying them. The result is a communication tool that helps regulators make informed decisions about managing Europe’s lakes.
Diverse scientific perspectives
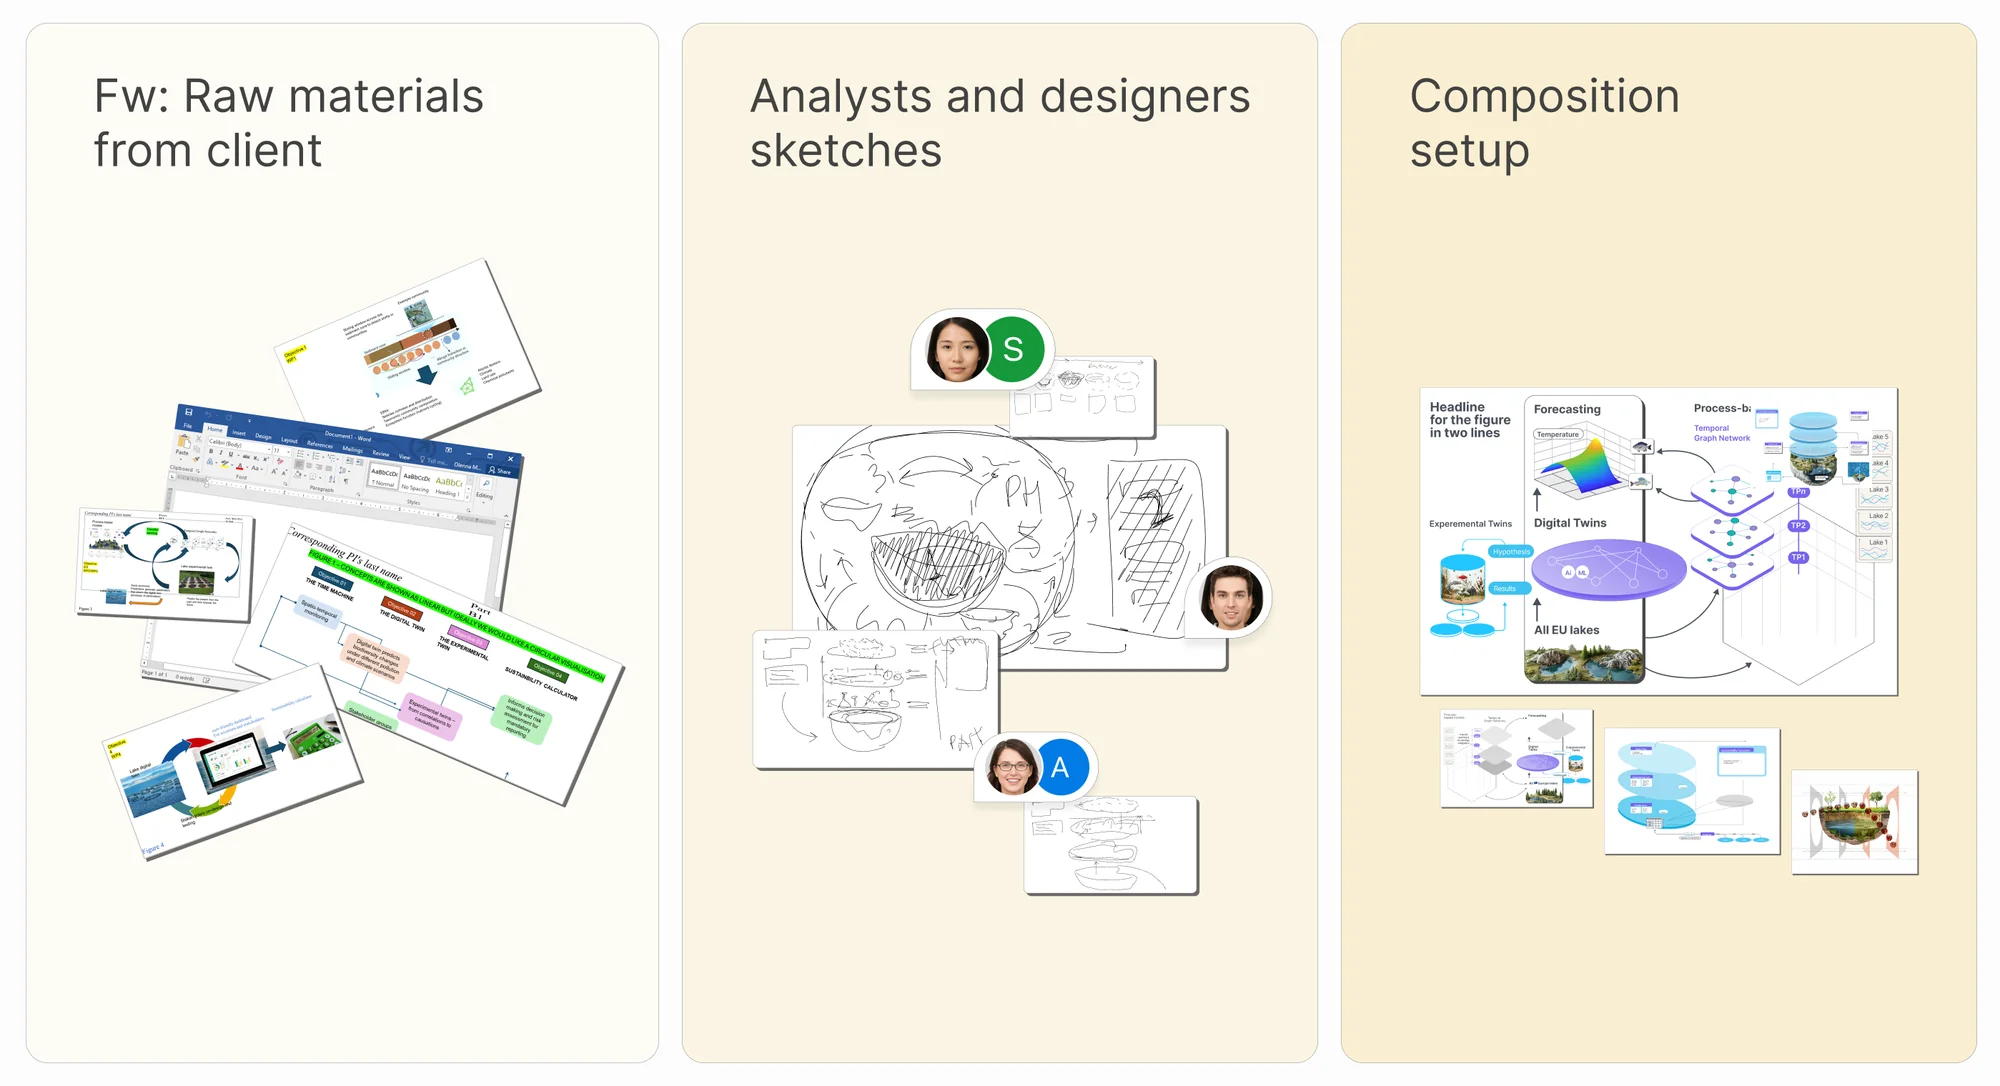
One of the main challenges was aligning scientists from different disciplines, whose views on how the data should be presented sometimes conflicted. We ran several joint sessions to reach consensus while keeping the science intact.
Balancing accuracy with simplicity
Every illustration had to be simple enough to communicate without losing the technical accuracy of the data, and iterative reviews with the experts found that balance. Where we used AI-generated images, we kept their detail high enough to carry the message but not so high that they overpowered the custom design elements. AI is one more tool in the designer’s kit, not the composition itself.
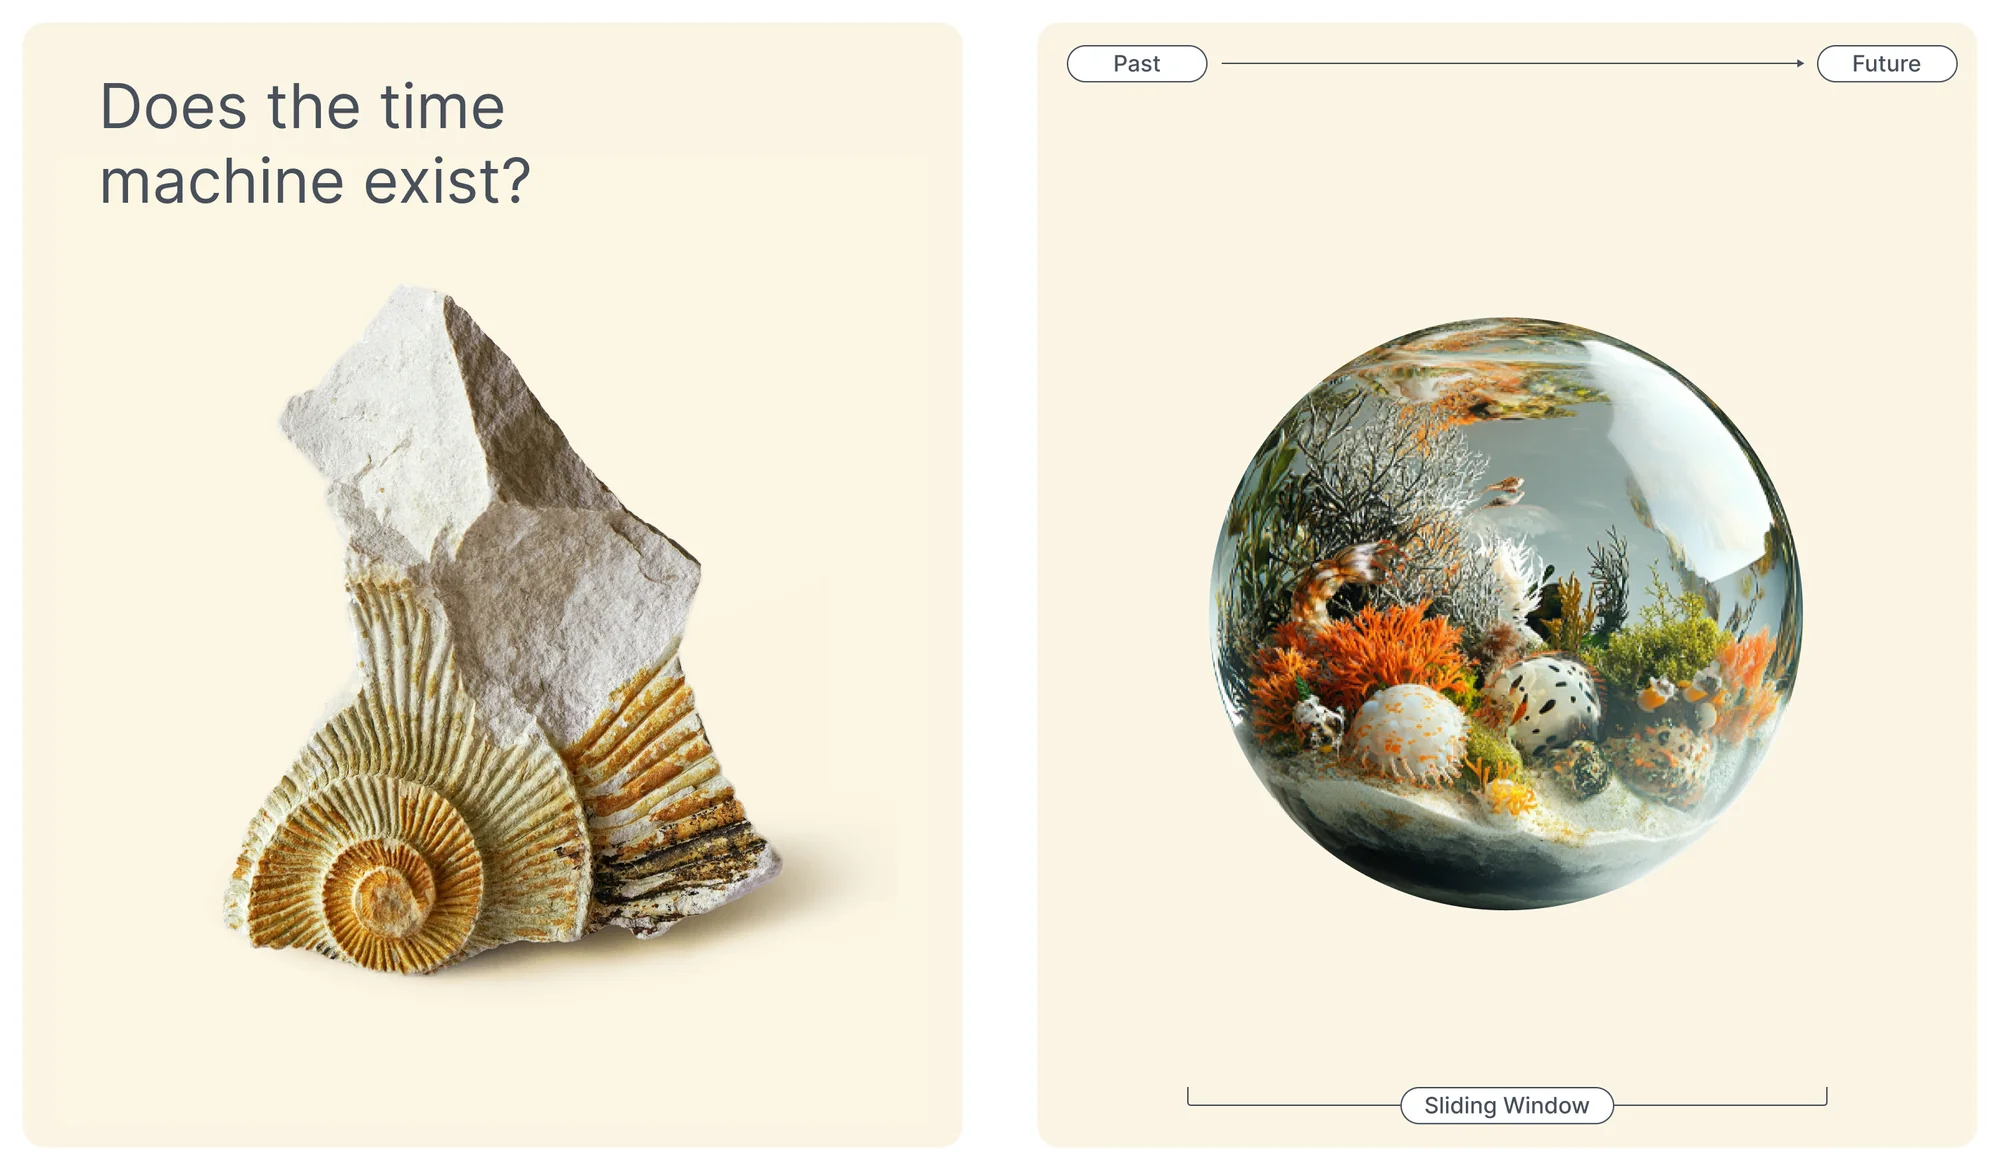
Diagrams
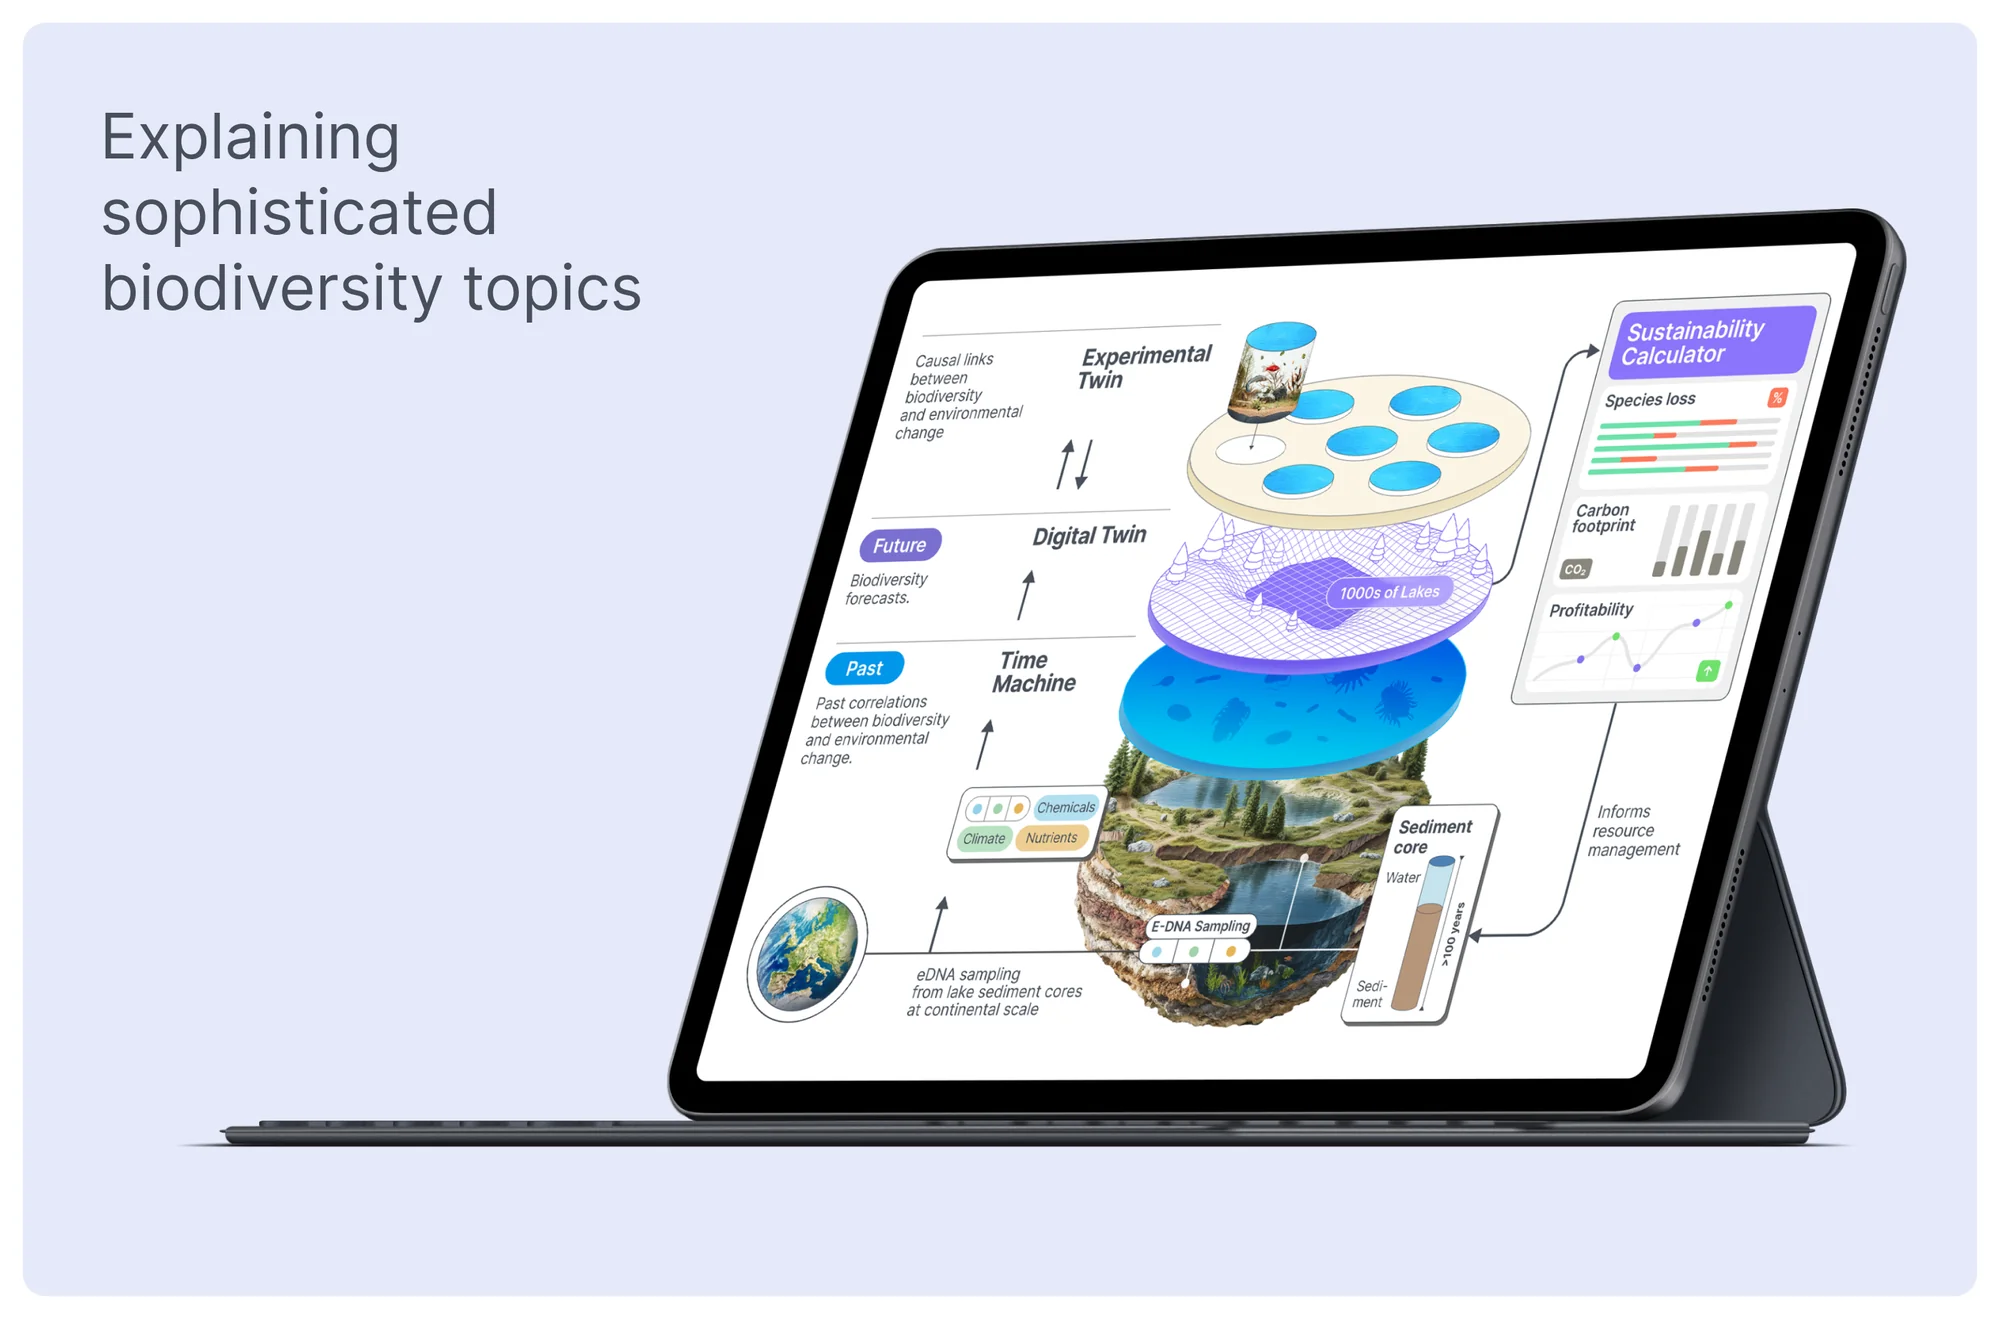
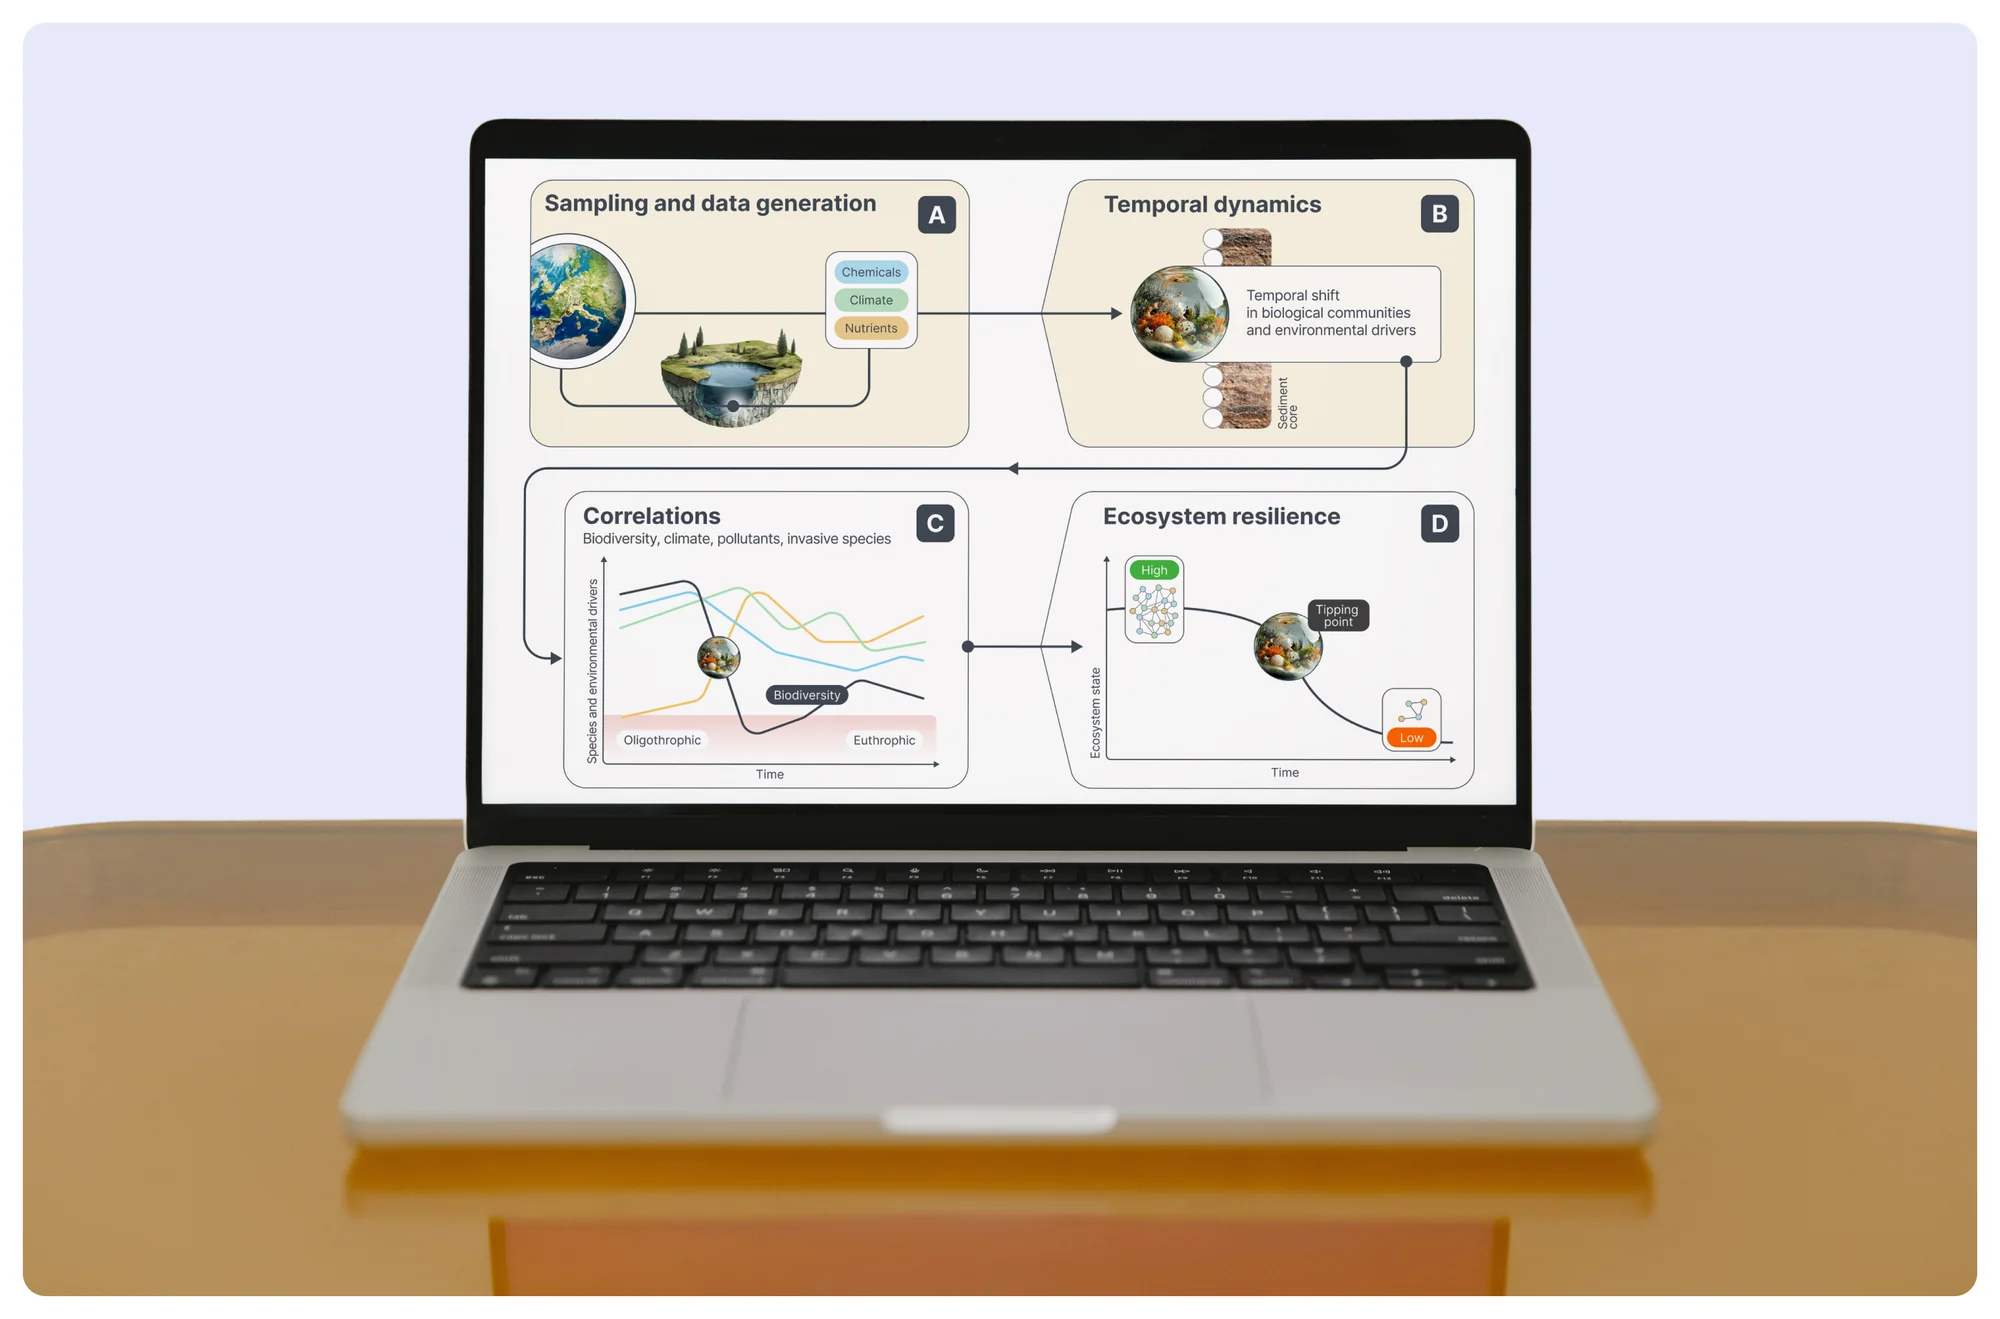
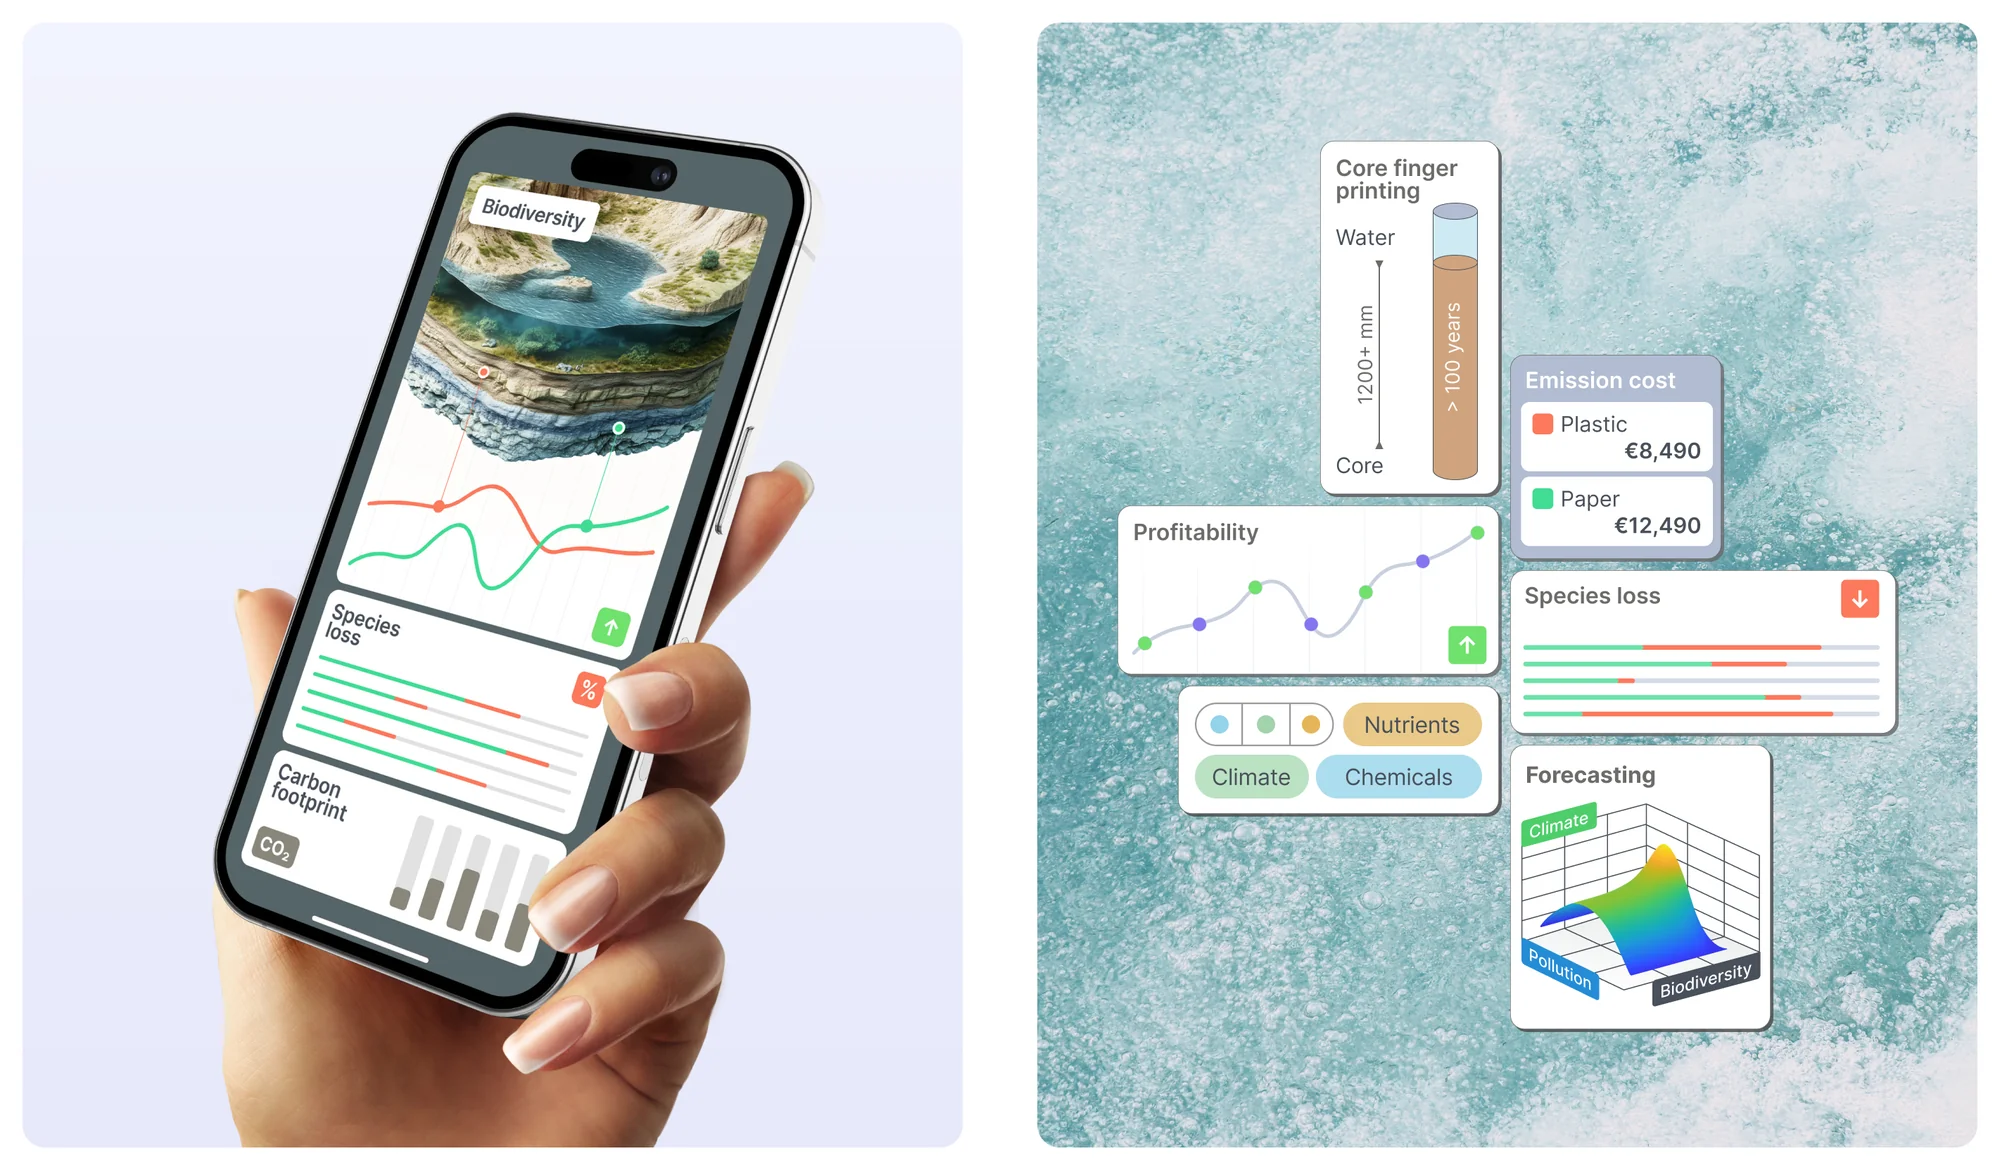
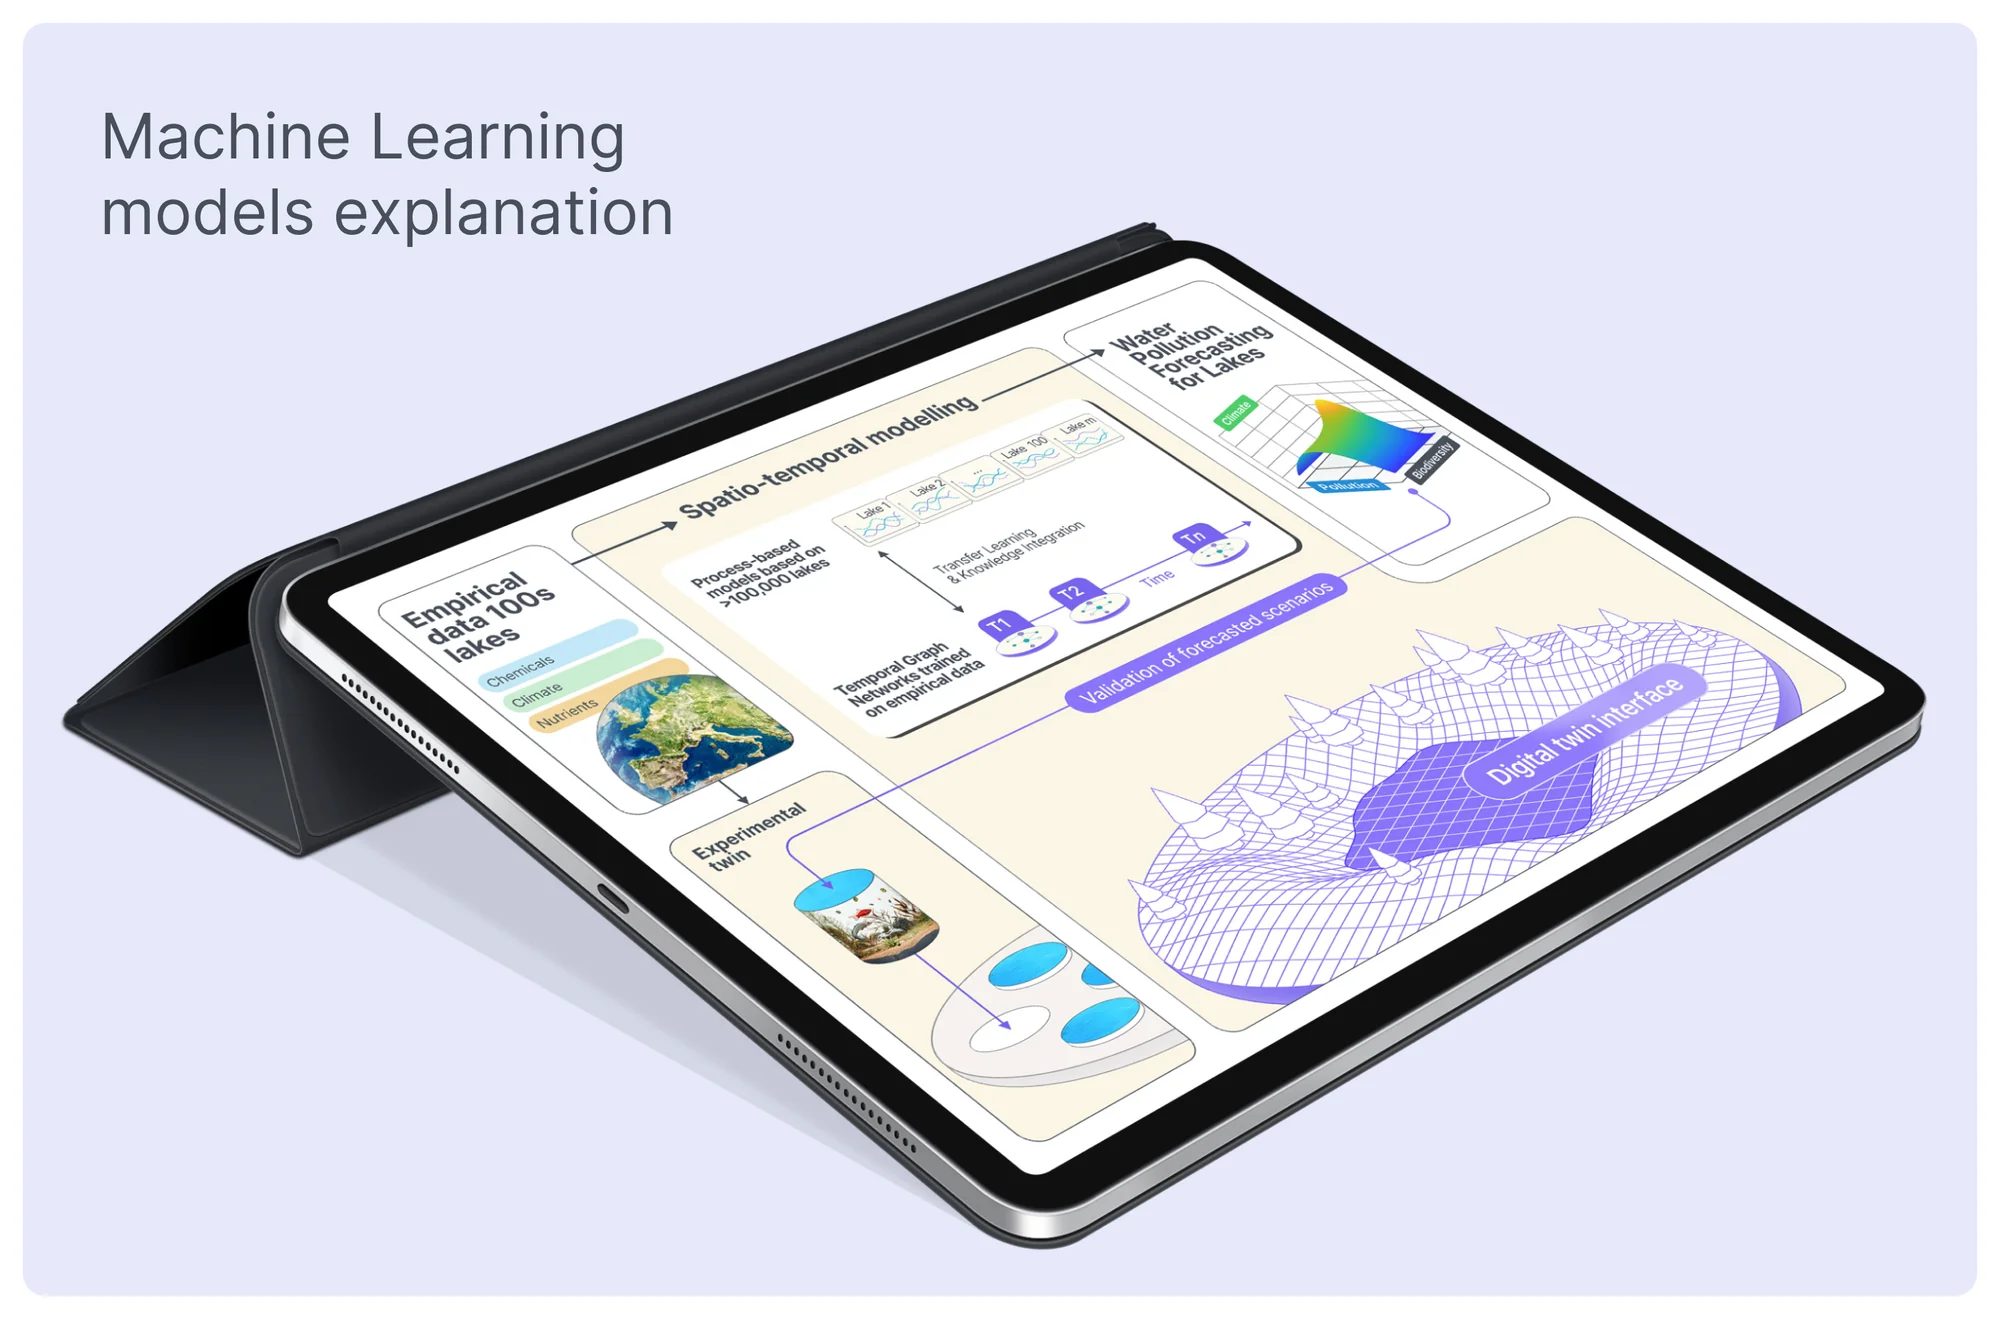
Diagrams make complex information easier to understand and act on. We designed every chart to be purposeful and readable at a glance, not just good-looking.

Project manager: Denis Zatsepilin. Graphic designers: Andrey Frankfurt, Pavel Moroz. Creative strategist: Tatiana Stepanova. Art director: Ilya Uskoev. Need a sophisticated academic presentation or complex data visualization that tells your story? Schedule a call.