

Challenge
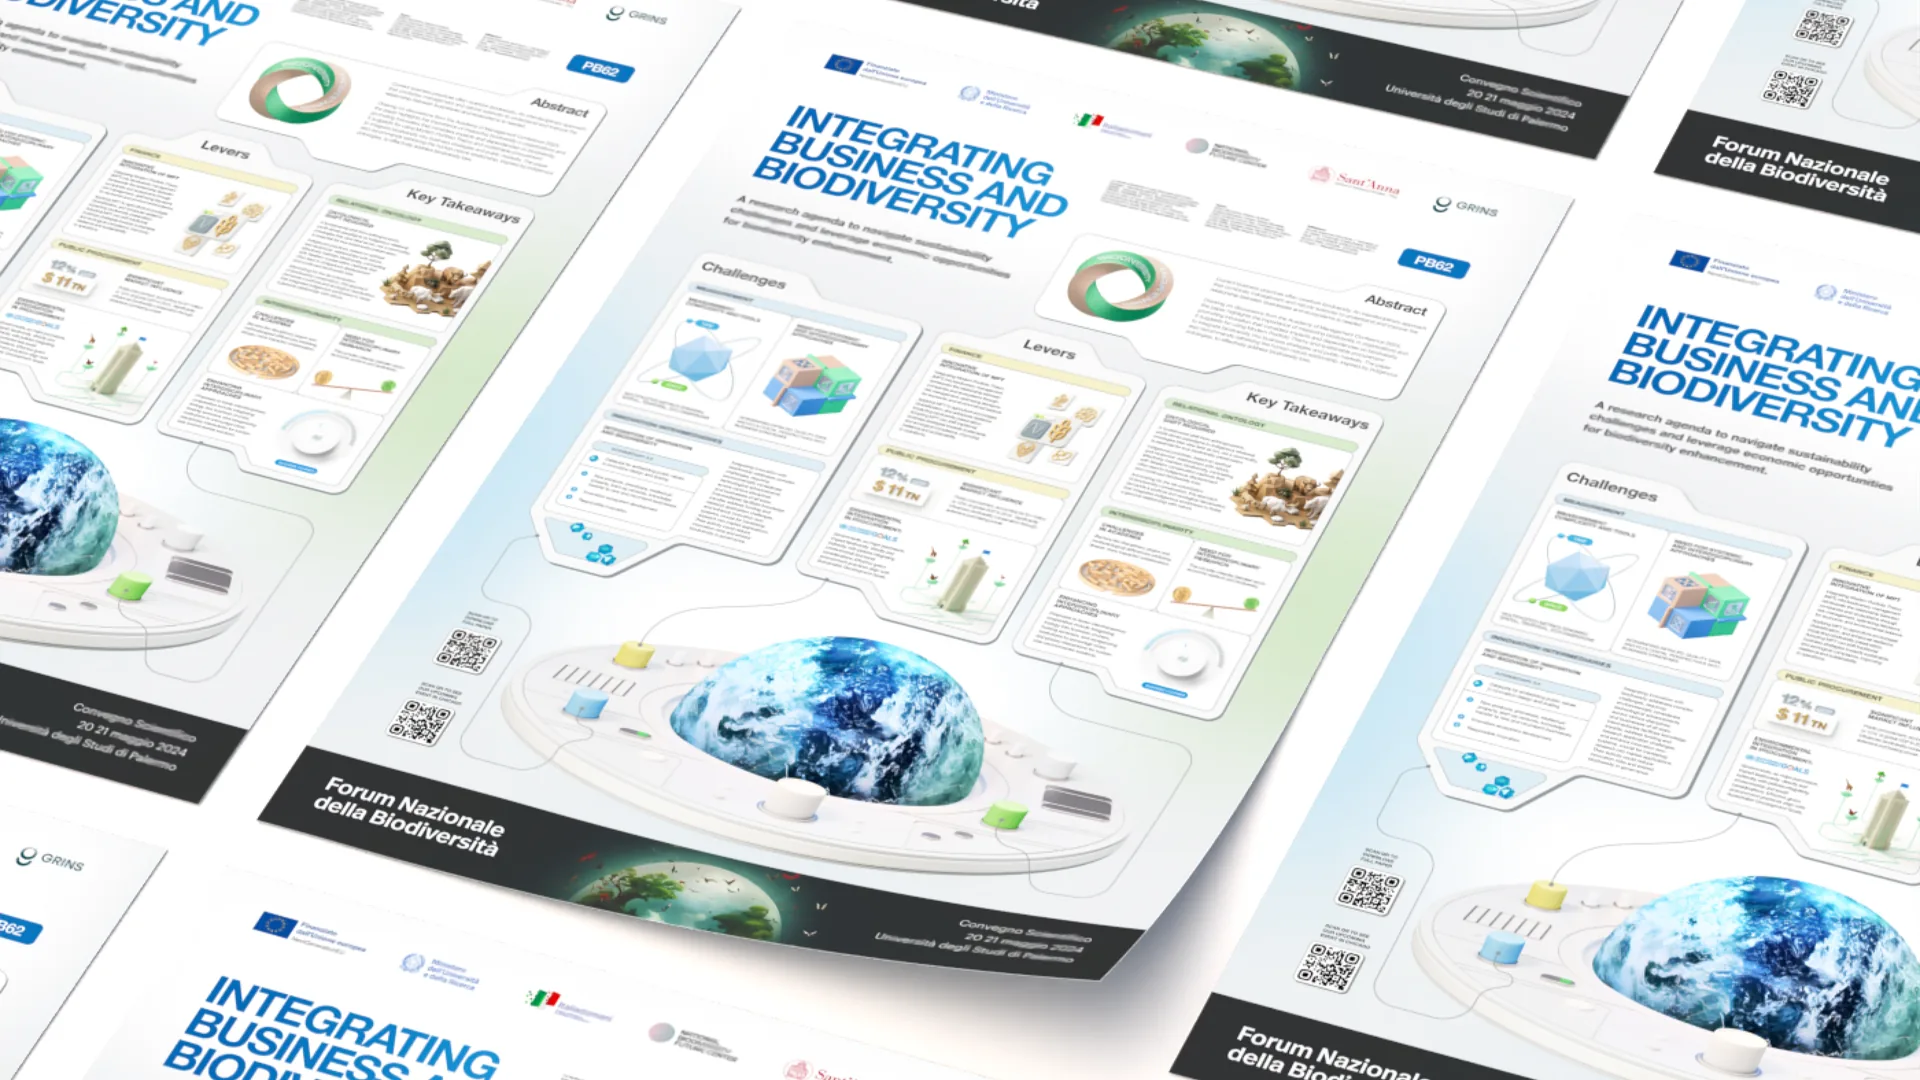
Visual design for large academic projects works on two levels. It takes academic experience to dig into the topic and find its core visual metaphors, and design experience to turn them into a framework that shows every part of the research clearly and consistently.
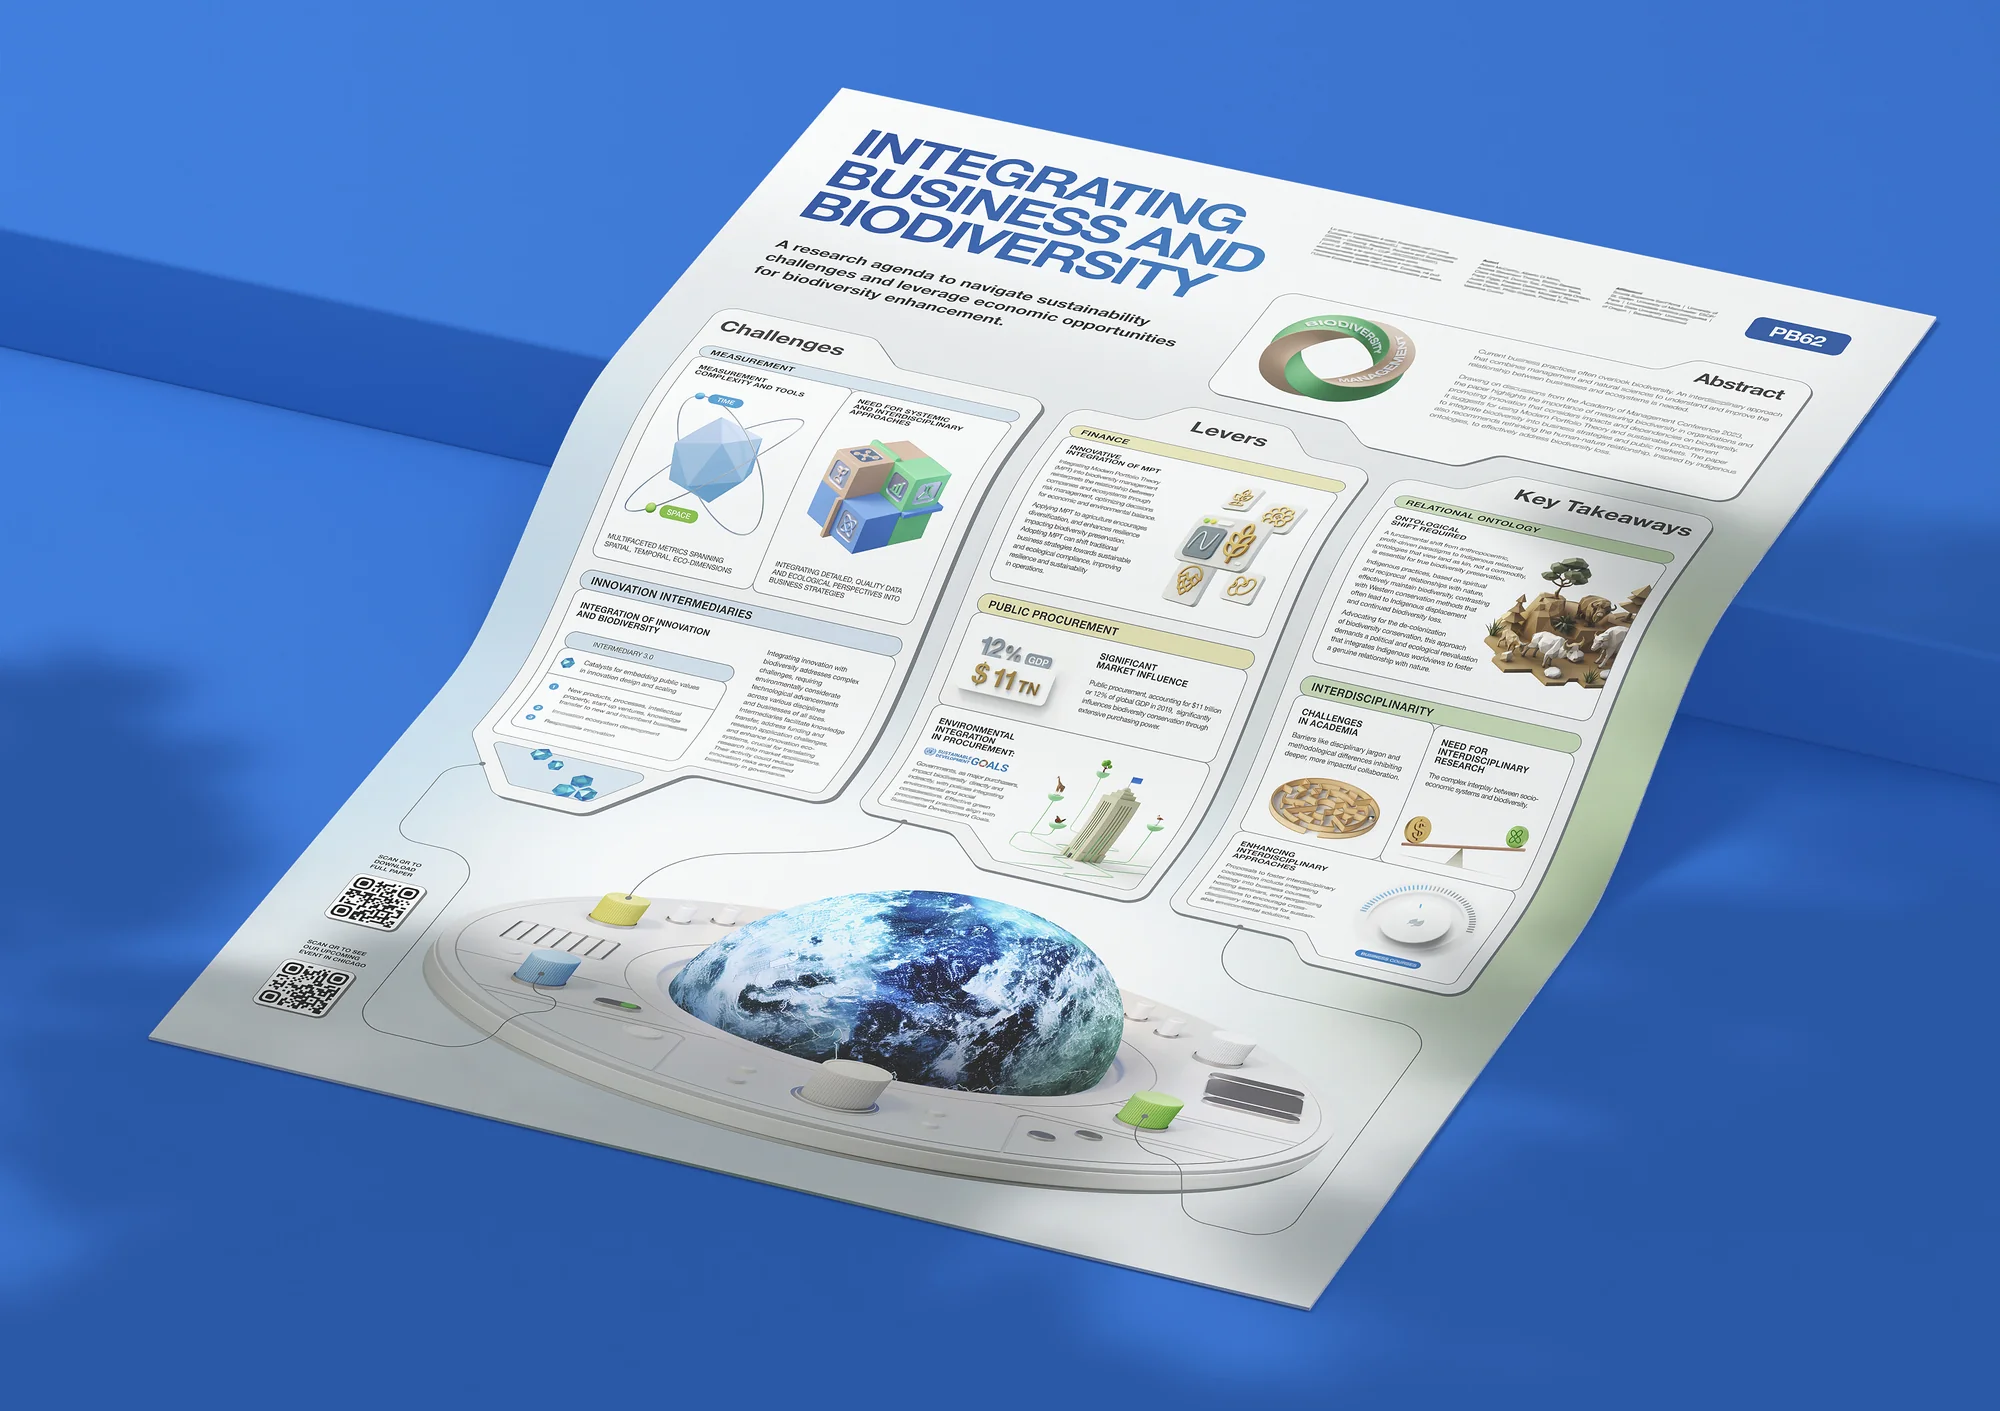
The infographic also has to unfold the idea step by step while guiding the reader’s attention. That’s hard to do on a short deadline for a team of researchers with no design background, and just as hard for designers with no academic one. This poster sets out a research agenda for integrating business and biodiversity: the challenges, the levers that can change practice, and the key takeaways.
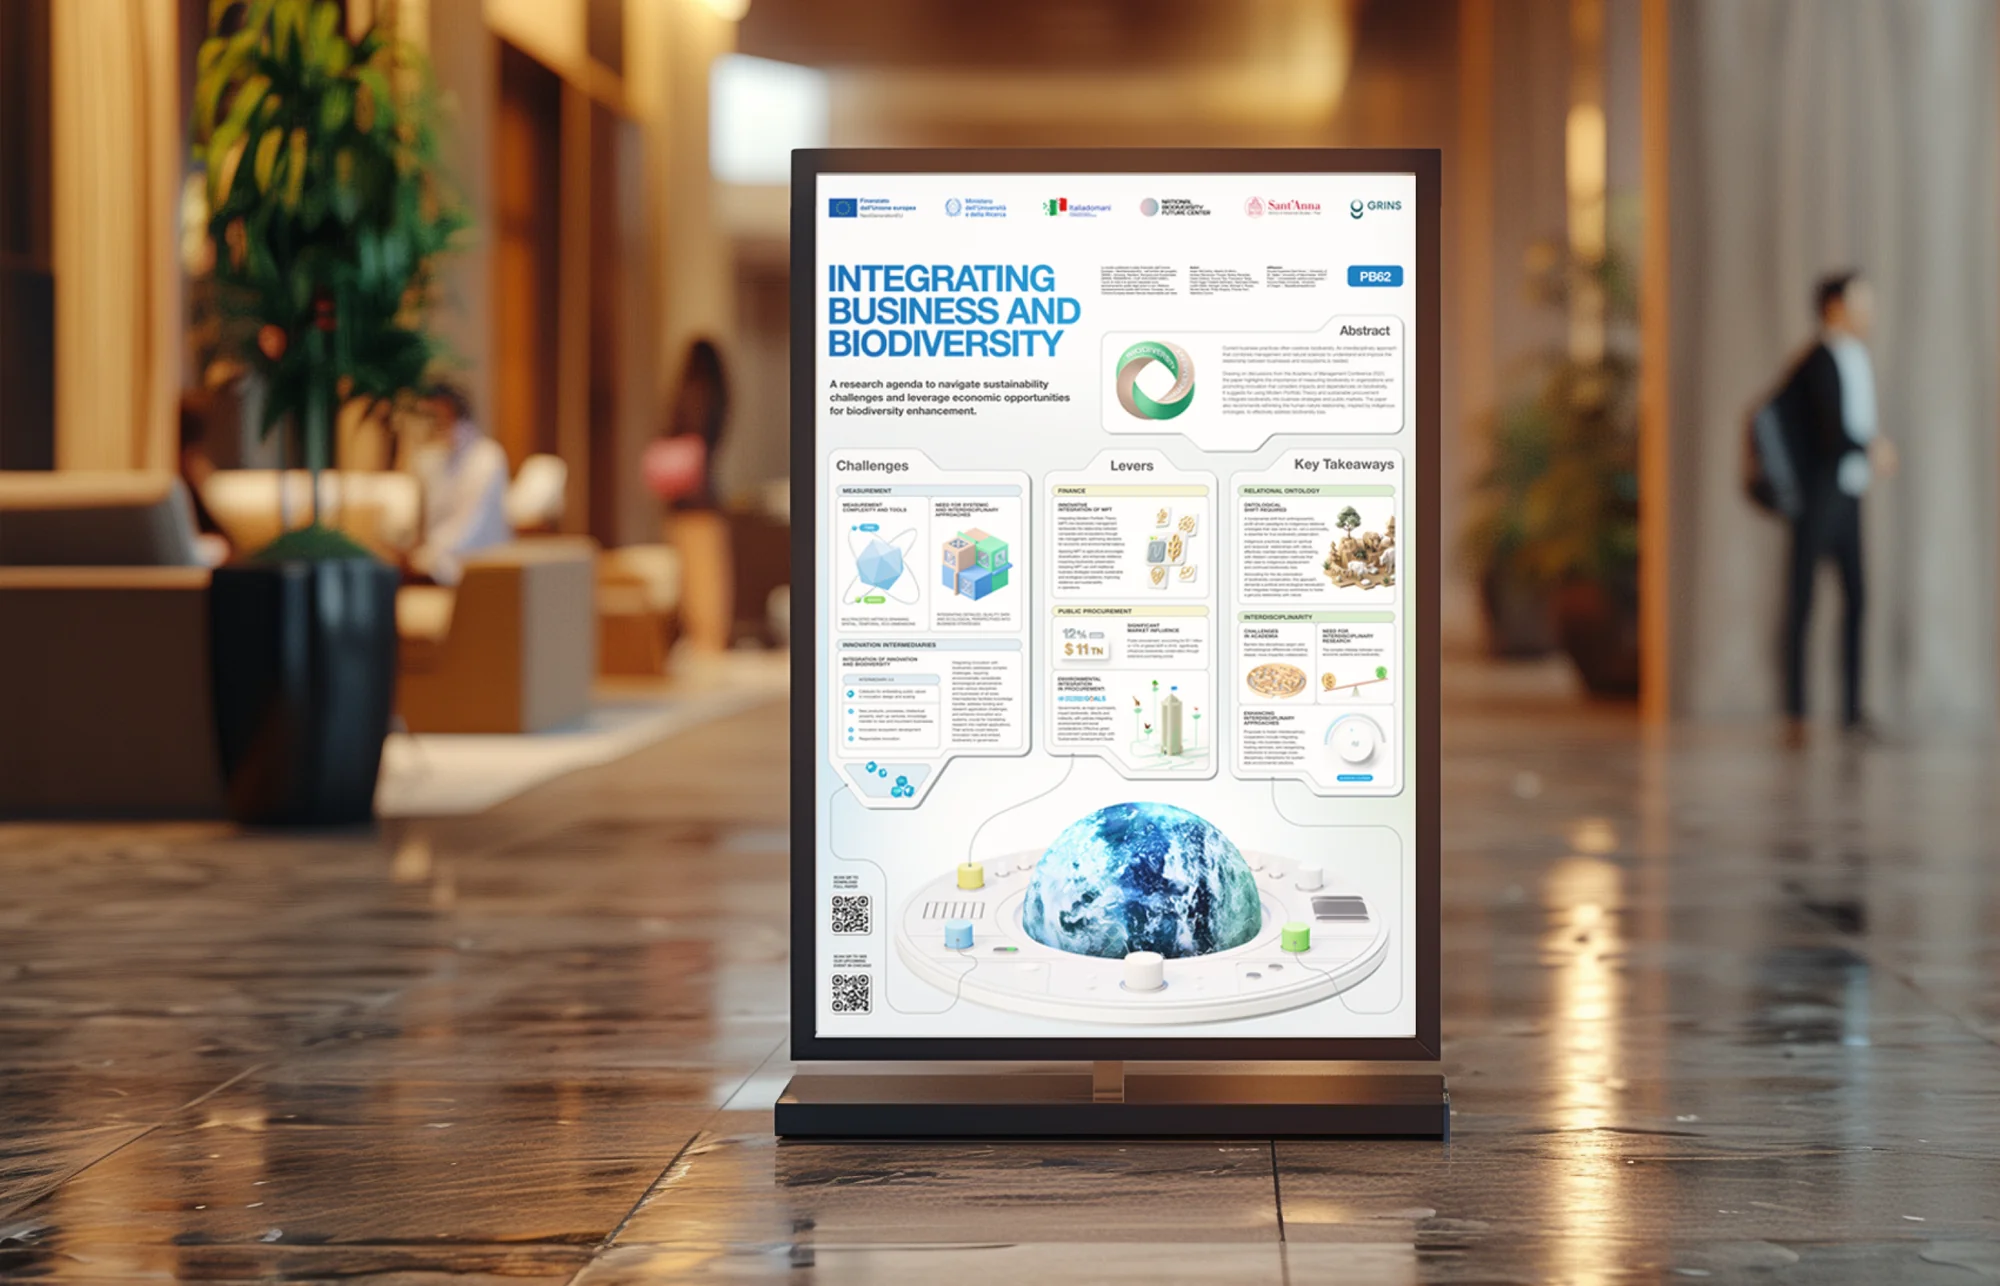
Key visual
At a high level, integrating business and biodiversity looks simply structured. Once you go into detail, it quickly gets overwhelming: the narrative isn’t linear, the sub-topics are partly connected or depend on each other, and explaining one often means explaining two others first.
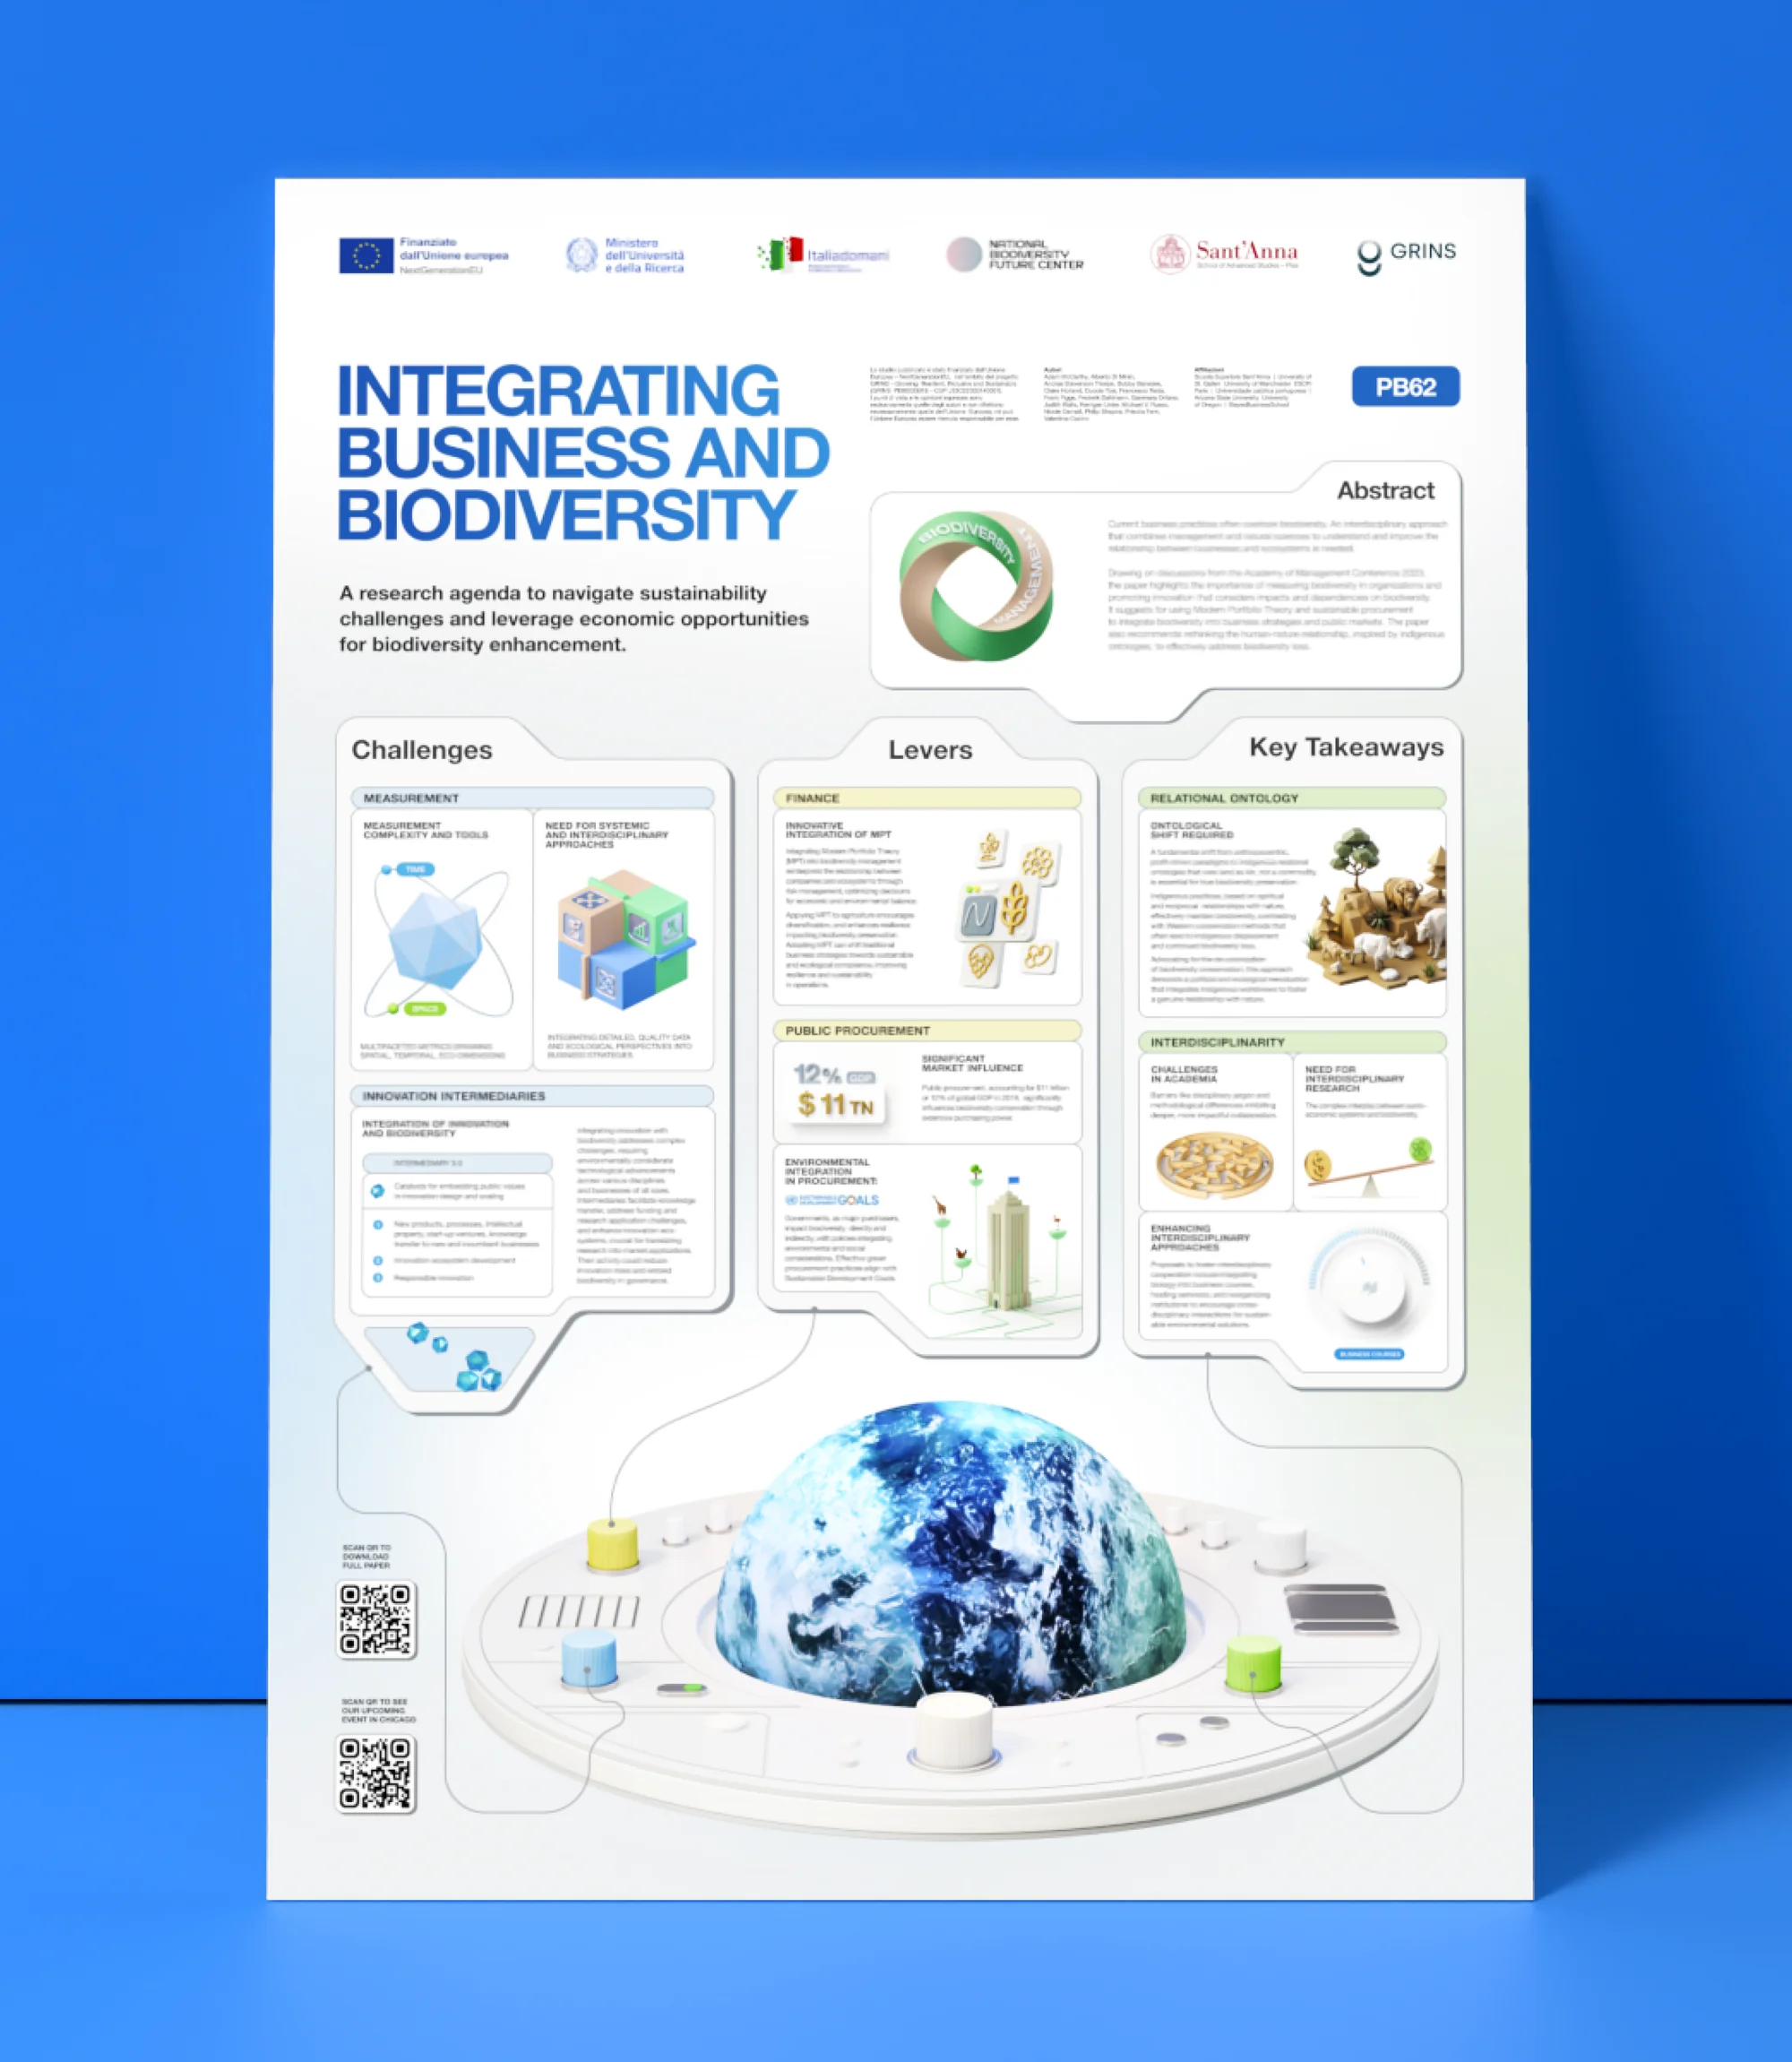
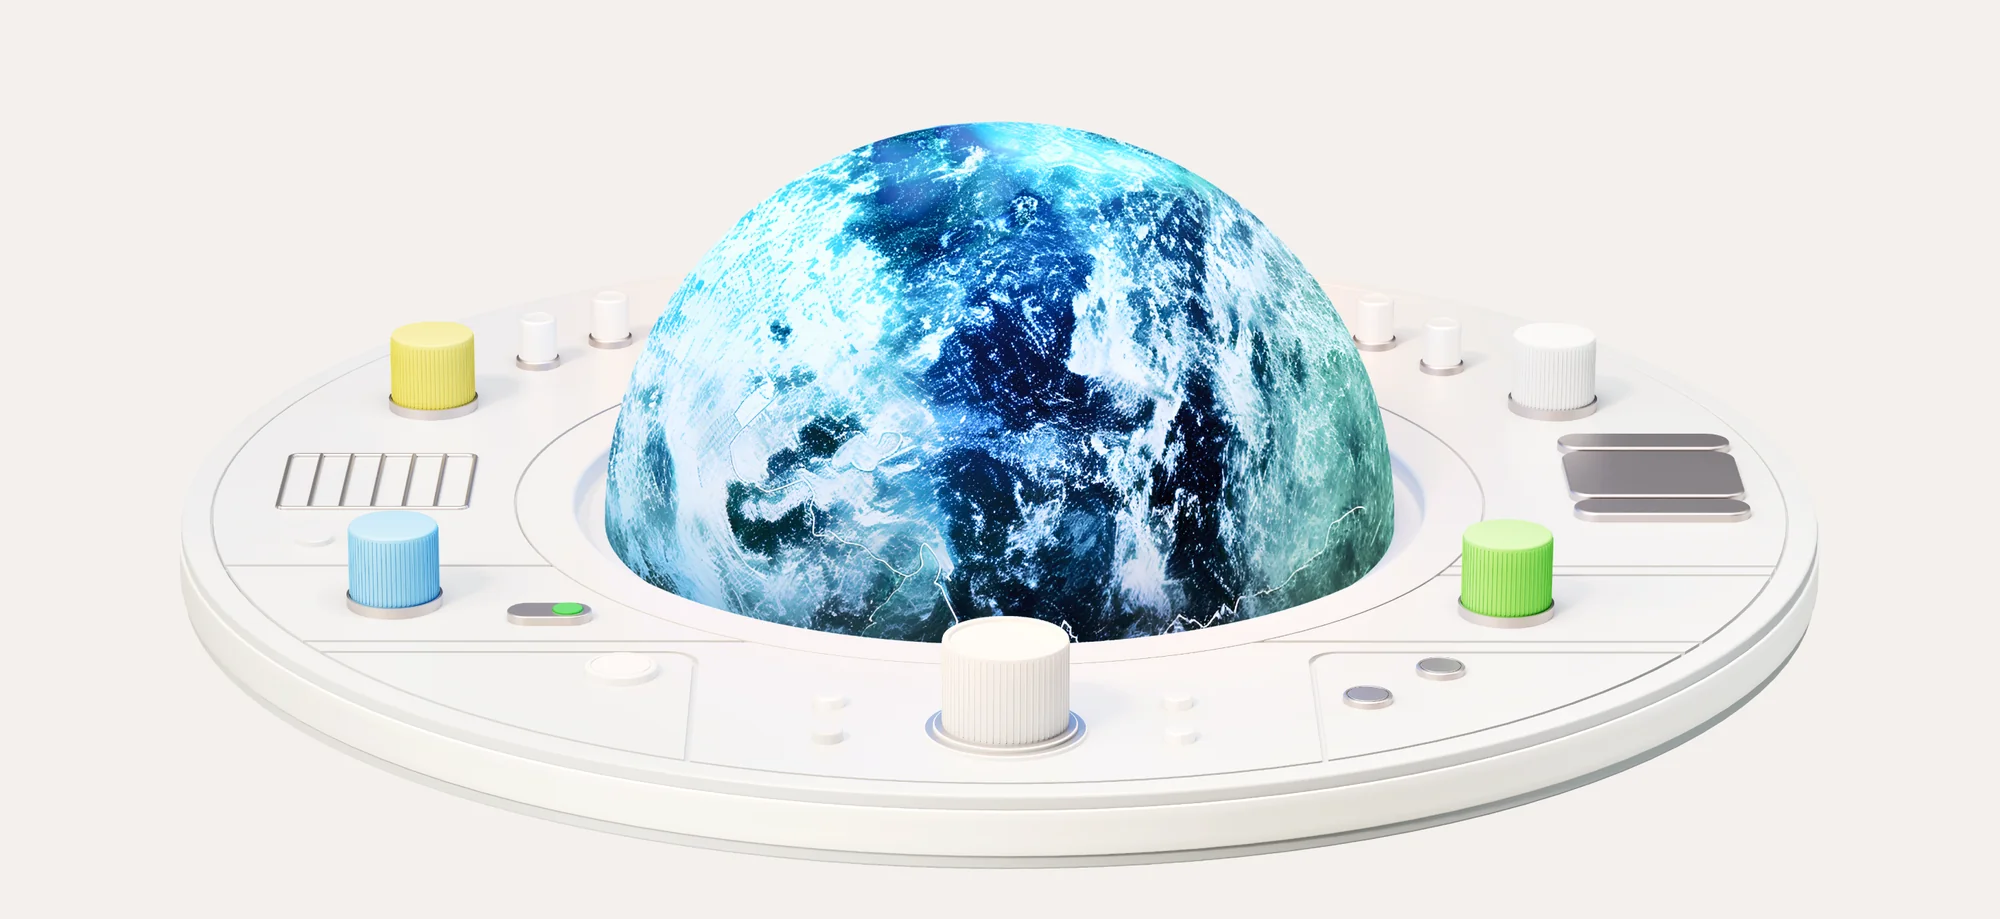
We built the poster around one key visual, the planet set into a control panel, with every section wired to it, so readers always see how the parts connect. Choosing and combining the right communication frameworks takes experience with data-heavy content. It goes well beyond consistent fonts, sizes and colours: complex content stays accessible and engaging without being oversimplified.
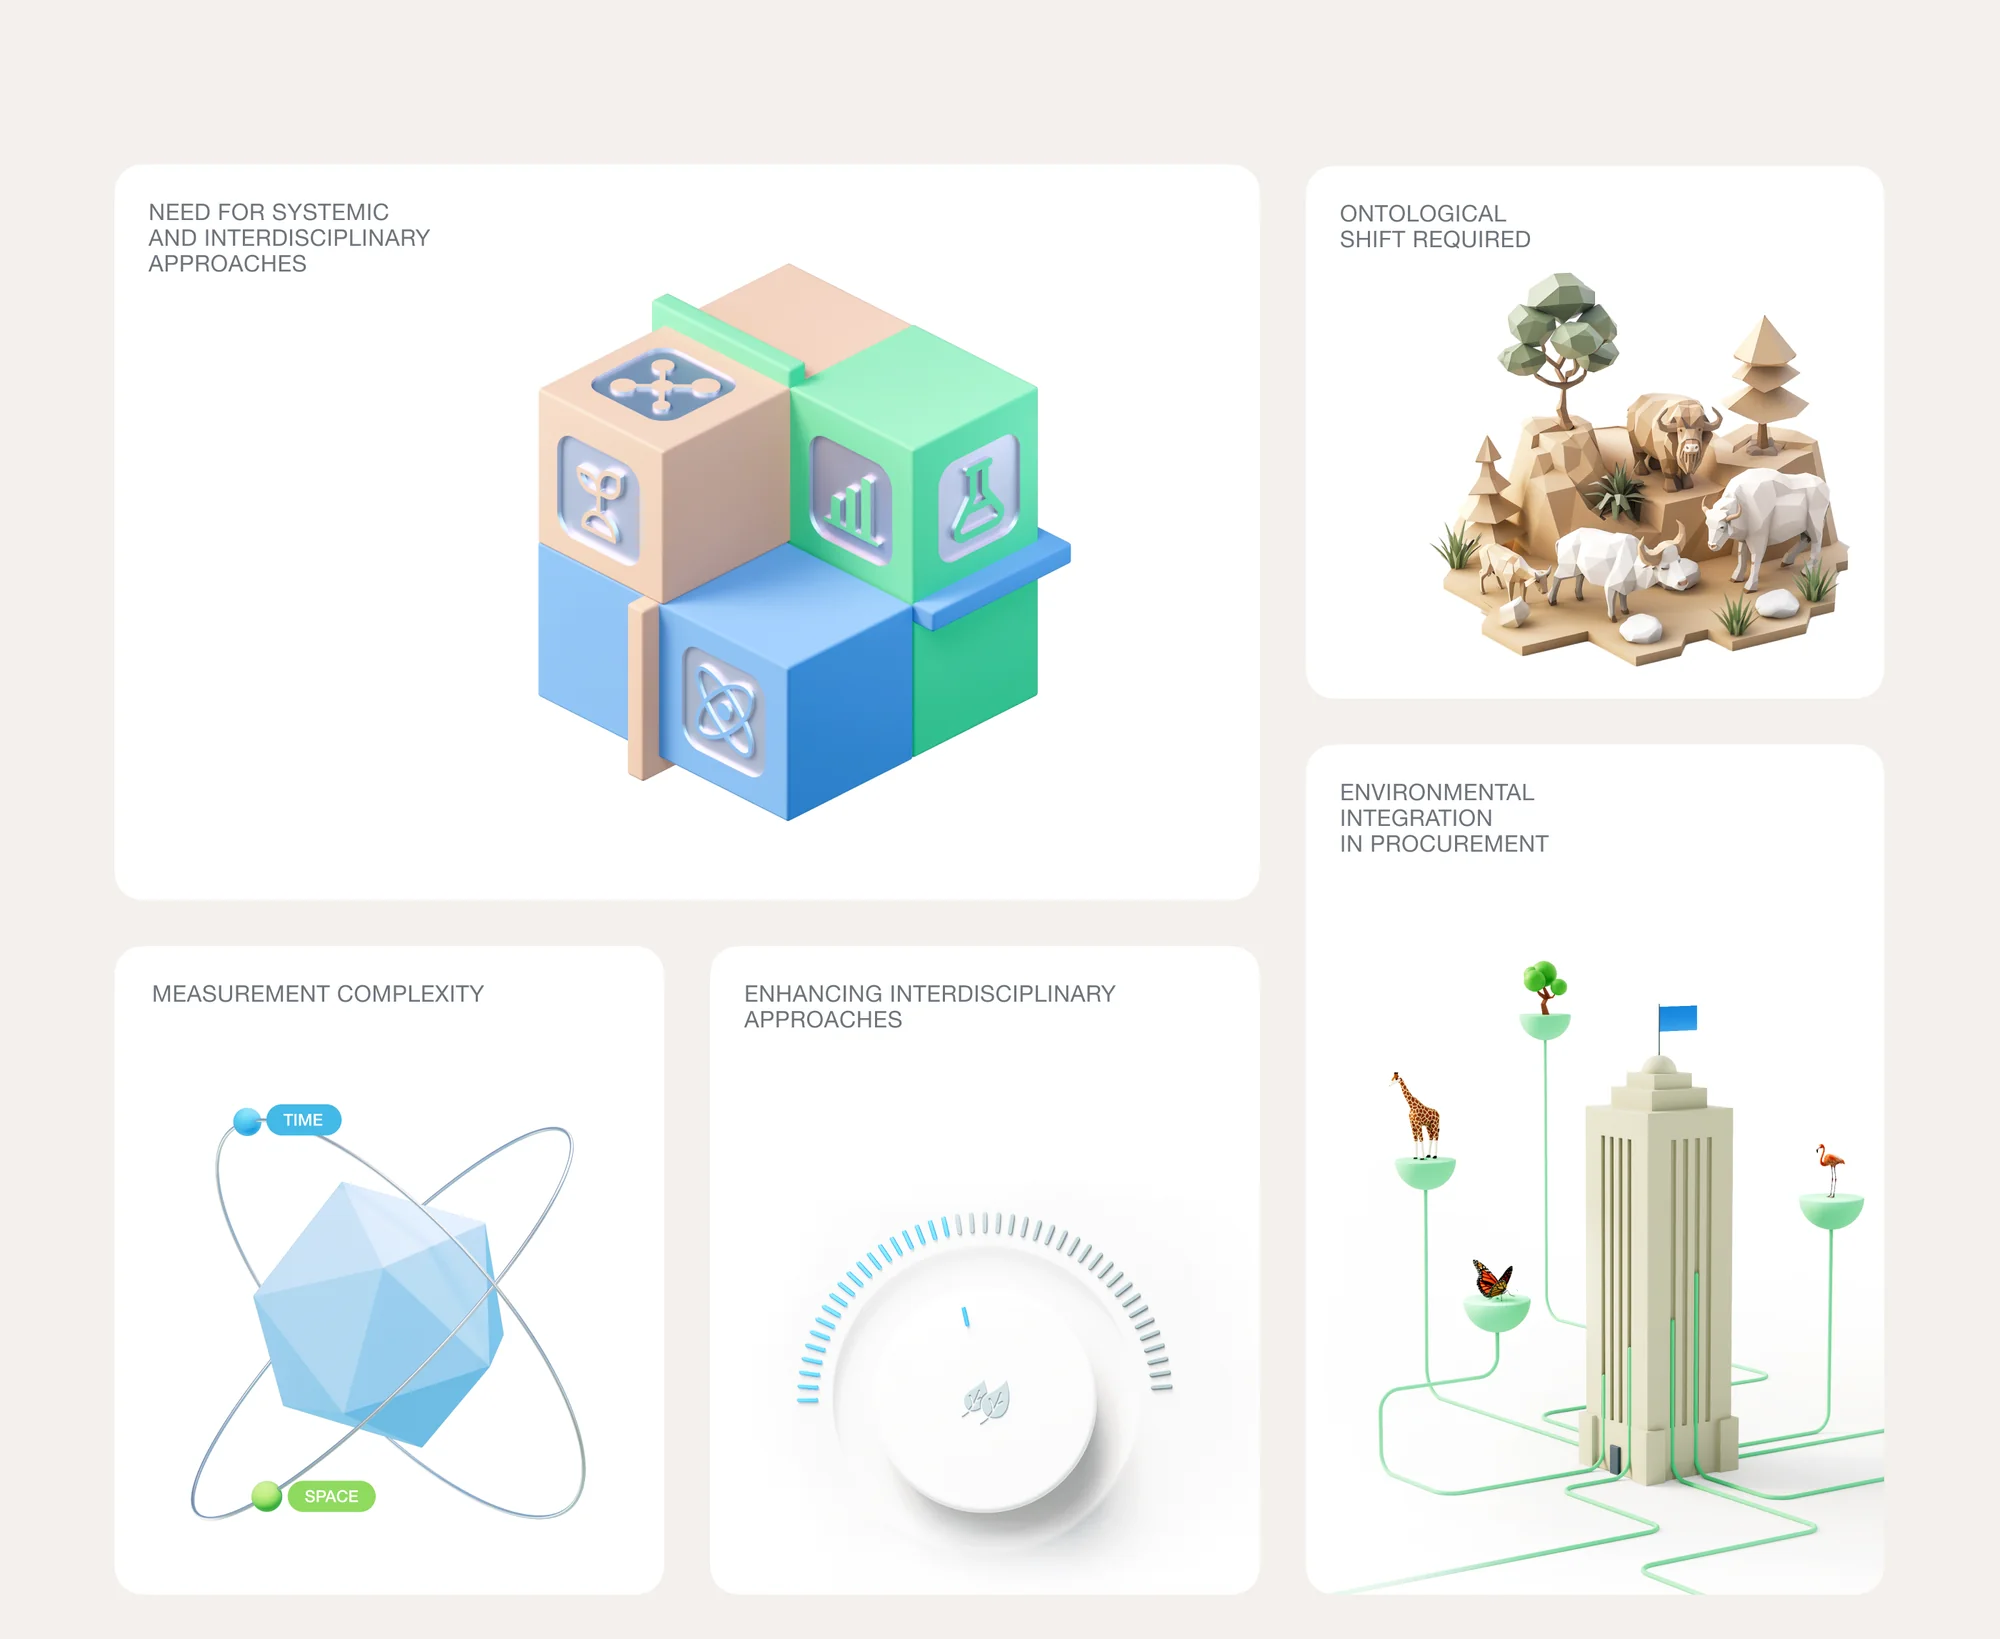
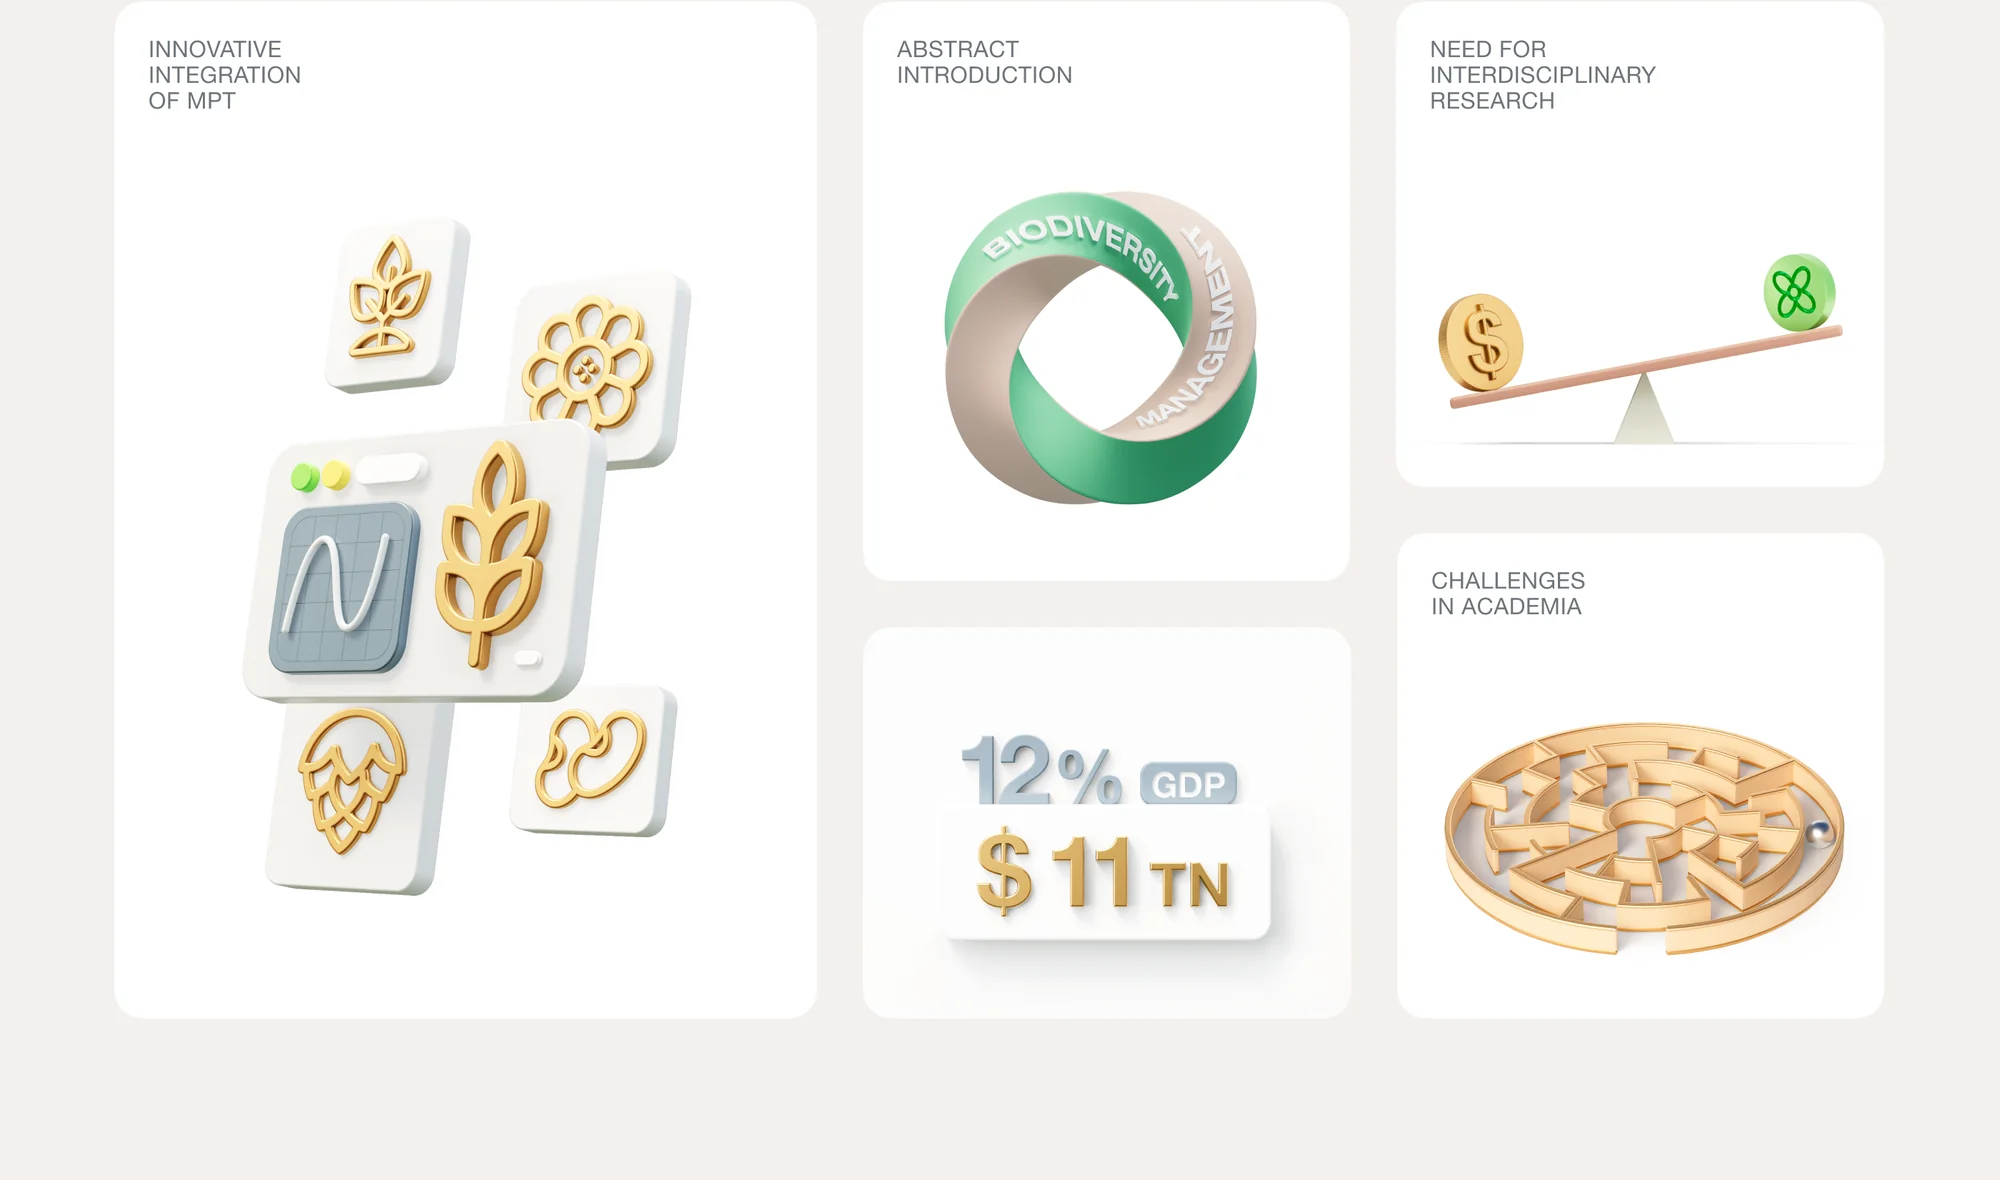
3D illustrations
Every block on the poster has its own 3D illustration, from measurement complexity and interdisciplinary research to the ontological shift and environmental procurement, made in one shared material and palette so they read as a set.
Designer: Andrey Frankfurt. Creative director: Tatiana Stepanova. Need academic infographics or a research poster designed? Schedule a call.