
When Data Gets Messy: Turning Scientific Jargon Into Visual Gold

A scientist spends two summers sampling a lake.
A policymaker spends two minutes not reading the report.
The lake doesn't stand a chance.
Brilliant scientists with PhDs collecting mountains of data about European lakes, only for it to land with a sad thud on regulators' desks. Spreadsheet purgatory. The world's most boring game of telephone where the losers are... actual lakes.

Explore the complete case study for comprehensive details.
The problem: Smart people, complex data, no communication
Data collection is only half the battle. The real challenge lies in making that data comprehensible to the humans who need to act on it.
European regulatory officials were expected to make critical decisions about lakes based on spreadsheets that might as well have been written in hieroglyphics. Not because they lacked intelligence—but because the numbers hadn't been translated into a format their brains could process efficiently.
It's equivalent to serving a five-course meal in pill form. All the nutrients are present, but the experience of consuming it is entirely lost.
Our approach: Collaborative visualization with purpose
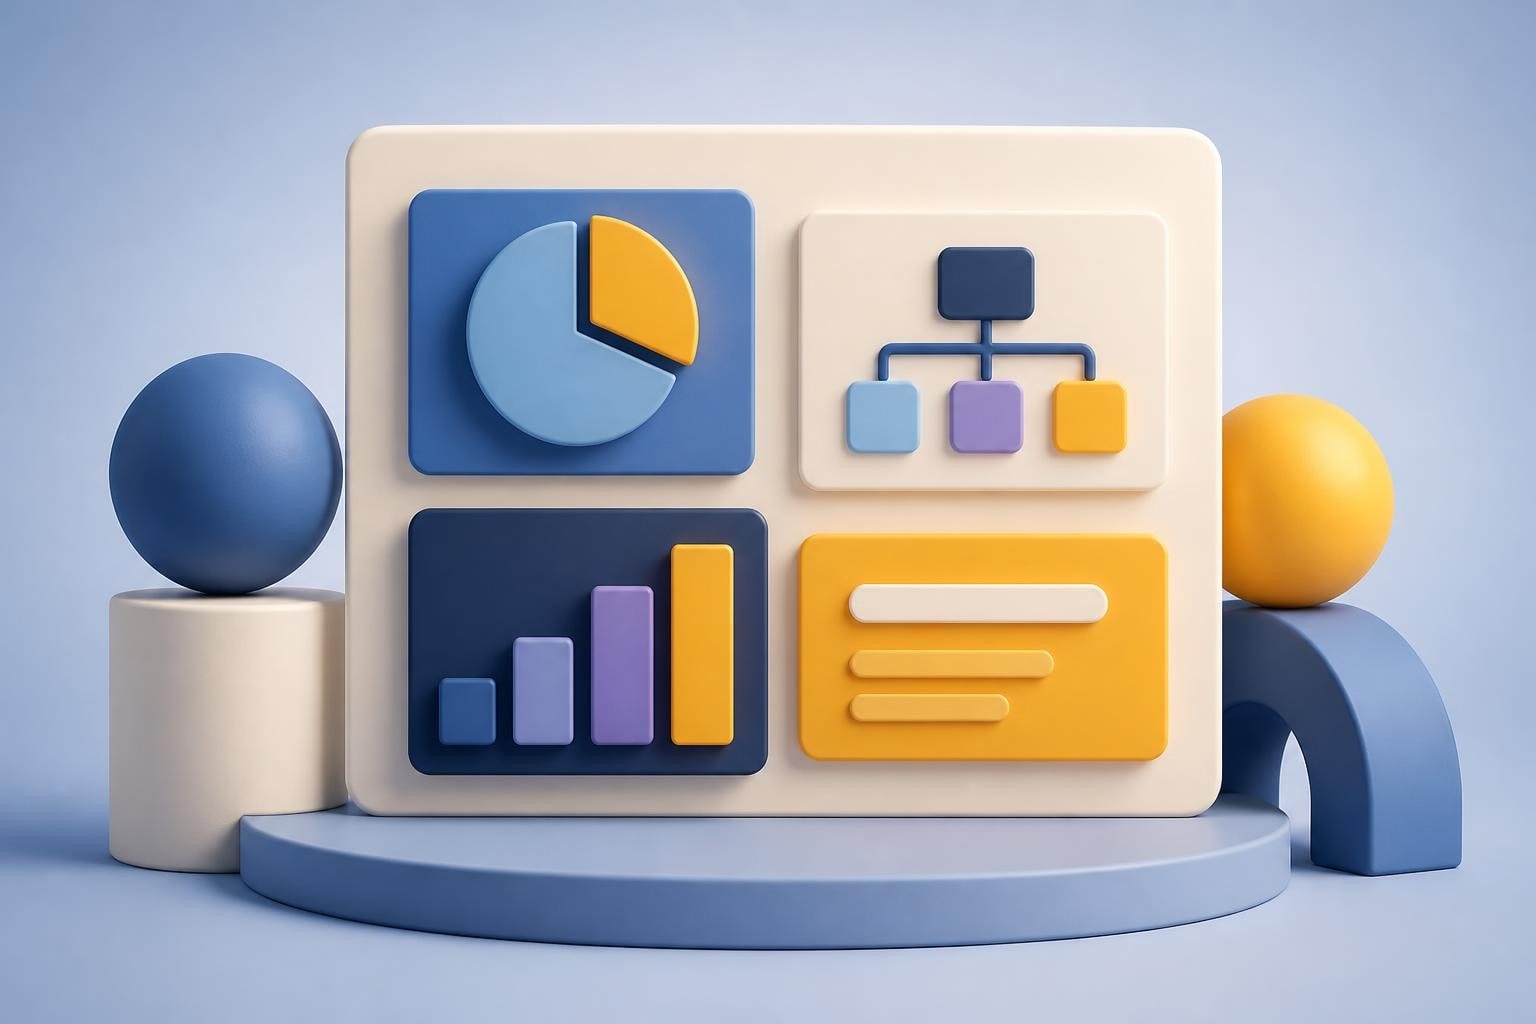
A well-crafted infographic can replace thousands of spreadsheet cells. But creating effective visualizations isn't just about aesthetics—it's about creating the right visual story that leads to action.
Making complex data look pretty is one challenge, but getting scientists from different disciplines to agree on data presentation is far more difficult. The real challenge emerges when bringing together a limnologist, an economist, and an environmental policy expert to find consensus on the most important metrics for lake management.
We tackled this challenge head-on by:
- Creating a collaborative environment where scientists could work through differences respectfully until finding common ground on what matters most.
- Implementing iterative design cycles through continuous feedback loops. We'd create, experts would evaluate, and we'd refine—repeatedly until reaching excellence.
- Focusing on actionable insights with every visual element answering the question: "How does this help someone make a better decision about lakes?"

Finding common ground across scientific disciplines.
Balancing complexity and clarity
Too simple? Scientific accuracy suffers. Too complex? Practical usability vanishes. Our challenge was finding the perfect balance point.
Through iterative design and consistent expert feedback, we created visualizations that achieved the optimal balance—scientifically accurate enough to satisfy researchers, yet clear enough for busy regulators to grasp key insights quickly.
The process resembled translating advanced concepts into an accessible format—preserving core ideas while making them universally understandable.

The difference-maker: Purpose-driven diagrams
Many data visualizations serve as mere visual enhancements without adding functional value. Our diagrams needed to bridge the gap between seeing information and acting on it.
What made our visual approach effective:
- Intuitive design patterns — We created visualizations aligned with natural information processing, making comprehension intuitive rather than effortful.
- Decision-focused elements — Each component highlighted precisely what regulators needed to know to make specific regulatory decisions.
- Scientific integrity — We maintained technical accuracy throughout, never sacrificing precision for visual simplicity.

Visualization designed for both understanding and action.
The real-world impact
Success in data visualization translates to better decision-making. Our work transformed European lake management in three key ways:
- Enhanced decision confidence — Regulators now comprehend the data landscape and can make informed choices with greater certainty.
- Unified stakeholder communication — Different participants now share a common visual language, eliminating the specialized terminology that previously hindered collaboration.
- Holistic ecosystem management — Environmental protection and economic considerations are now viewed as interconnected elements rather than competing priorities.
Beyond lakes: The wider application
If European lake management—hardly the most captivating topic—can be transformed through better visualization, the potential applications elsewhere are vast.
Most organizations face their version of this challenge: valuable data remains underutilized because it isn't presented in a human-processable format. Whether in healthcare, finance, technology, or any data-intensive field, effective visualization isn't a luxury—it's the bridge between information overload and insight-driven action.
Struggling with complex data? We transform information overload into visual clarity that drives decisions. Contact us or explore our other case studies to see how we've helped organizations like yours.


- This is some text inside of a div block.lay out the facts clearly and compellingly. Use data to establish the ground reality, but remember that facts alone are like the individual strands of a tapestry—necessary but not complete.lay out the facts clearly and compellingly. Use data to establish the ground reality, but remember that facts alone are like the individual strands of a tapestry—necessary but not complete.
- This is some text inside of a div block.lay out the facts clearly and compellingly. Use data to establish the ground reality, but remember that facts alone are like the individual strands of a tapestry—necessary but not complete.

