
Infographic Design Agency: Transform Complex Data
In today's data-saturated business environment, financial and tech companies face a critical challenge: transforming complex information into digestible visual stories that resonate with stakeholders. An infographic design agency specializes in this exact transformation, converting dense datasets, market research, and technical specifications into compelling visual narratives. For businesses seeking to communicate intricate financial models, cybersecurity frameworks, or technological innovations, partnering with specialized design experts can mean the difference between audience confusion and genuine engagement. This specialized service goes beyond simple chart creation, encompassing strategic visual storytelling that aligns with brand identity and business objectives.
Understanding the Strategic Value of Professional Infographic Design
An infographic design agency brings specialized expertise that extends far beyond aesthetic appeal. These agencies understand the psychology of visual communication, leveraging design principles that guide viewer attention and enhance information retention. Research consistently demonstrates that visual content is processed 60,000 times faster than text, making infographics an essential tool for busy executives and decision-makers.
For financial services and technology companies, the stakes are particularly high. Complex products require clear explanation, and market differentiation often hinges on how effectively a company communicates its value proposition. When you work with a dedicated agency, you gain access to professionals who understand both design fundamentals and industry-specific communication challenges.
Core Services Offered by Specialized Agencies
Professional infographic design encompasses several distinct service categories:
- Data visualization: Transforming spreadsheets and analytics into meaningful charts, graphs, and visual representations
- Process mapping: Illustrating workflows, customer journeys, and operational procedures
- Statistical storytelling: Presenting research findings and market data through engaging visual narratives
- Comparison frameworks: Creating side-by-side analyses of products, services, or market positions
- Timeline development: Visualizing company history, project phases, or industry evolution
Each service requires specific technical skills and design knowledge. According to best practices for designing effective infographics, understanding your audience and choosing the right visualization type are foundational to success.
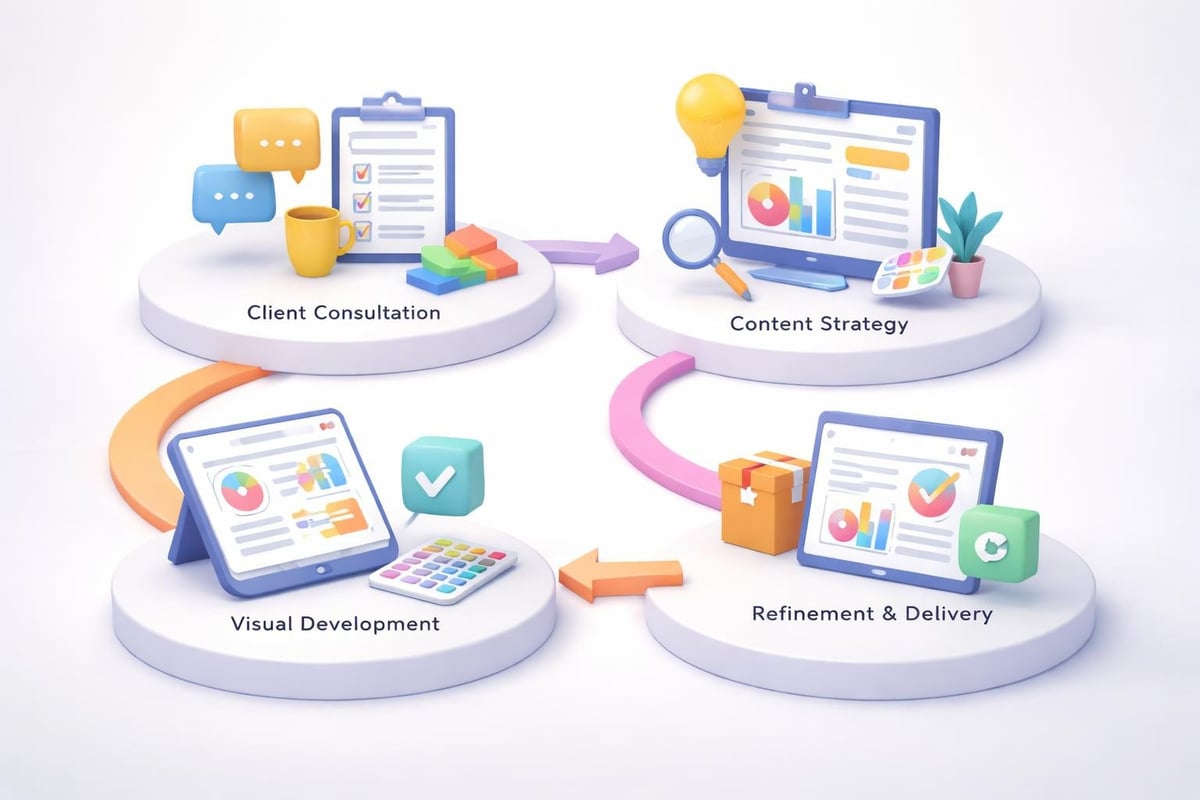
The Design Process: From Concept to Completion
Working with an infographic design agency typically follows a structured methodology that ensures alignment between business objectives and visual output. This process begins long before any design software is opened.
Discovery and Strategy Development
The initial phase involves comprehensive discovery sessions where designers work to understand your business context, target audience, and communication goals. Strategic questions drive this phase: What action should viewers take after seeing the infographic? What misconceptions need correction? Which data points carry the most significance?
For technology companies presenting professional PowerPoint materials, this alignment between visual design and business strategy proves essential. Financial firms pitching to investors need infographics that build confidence while simplifying complex instruments or market positions.
- Audience analysis: Identifying knowledge level, pain points, and decision-making criteria
- Content audit: Reviewing existing data, reports, and source materials
- Objective setting: Defining specific, measurable outcomes for the visual communication
- Format selection: Determining whether static images, interactive elements, or presentation slides work best
- Timeline establishment: Creating realistic delivery schedules with review milestones
Content Development and Information Architecture
Once strategy is established, an infographic design agency moves into content structuring. This phase determines what information appears, in what sequence, and with what emphasis. Infographic best practices emphasize the importance of creating engaging headlines and defining clear narrative flow.
The information architecture phase involves:
| Activity | Purpose | Outcome |
|---|---|---|
| Data prioritization | Identify most important metrics | Clear hierarchy of information |
| Narrative structuring | Create logical flow | Coherent story arc |
| Key message extraction | Distill complex ideas | Memorable takeaways |
| Supporting detail selection | Provide context without clutter | Balanced information density |
This systematic approach ensures that the final infographic communicates efficiently without overwhelming viewers. For presentations requiring marketing presentation PPT elements, this careful balance becomes crucial.
Design Principles That Drive Engagement
An infographic design agency applies proven visual communication principles that maximize comprehension and retention. These principles aren't arbitrary aesthetic choices but evidence-based strategies that leverage human cognitive processing.
Visual Hierarchy and Information Flow
Visual hierarchy guides viewers through content in intentional sequences. Through strategic use of size, color, contrast, and positioning, designers control where attention lands first and how it progresses through the infographic. This proves particularly valuable when presenting financial data where specific metrics need emphasis or when illustrating complex technical processes.
The fundamentals of infographic design highlight how proper hierarchy prevents viewer confusion. Without clear visual guidance, audiences struggle to determine which information matters most, undermining the entire communication effort.
- Primary elements: Large headlines, key statistics, or central concepts that anchor the design
- Secondary elements: Supporting data, explanatory text, or contextual information
- Tertiary elements: Citations, disclaimers, or supplementary details
Color Theory and Brand Integration
Color selection extends beyond personal preference. Professional agencies understand color psychology and its impact on message reception. Financial infographics often employ blue and green tones to convey trust and stability, while technology companies might leverage bold, energetic palettes that signal innovation.
Brand consistency remains paramount. An infographic design agency ensures that visual materials align with existing brand guidelines, maintaining color schemes, typography, and design language that reinforce brand recognition. This consistency proves essential when creating cybersecurity pitch decks or investor materials where brand credibility influences decision-making.

Typography and Readability Optimization
Text remains a critical component of infographic design, even in highly visual formats. An infographic design agency carefully balances typography choices to ensure readability while maintaining visual interest. Poor font selection or improper hierarchy can undermine even the most compelling data.
Font Selection Strategies
Professional designers typically employ a limited font palette, often using two to three complementary typefaces. Sans-serif fonts generally work best for digital infographics, offering clean readability across devices and screen sizes. For financial services companies, conservative, professional typefaces build credibility, while tech startups might adopt more contemporary or distinctive fonts that signal innovation.
The comprehensive guide to infographic design emphasizes typography as a foundational element, noting that typeface choices directly impact viewer perception and information absorption. This consideration extends to presentations and layout for PPT materials where consistency between infographic elements and slide design creates cohesive visual communication.
Data Visualization Best Practices
Converting raw data into meaningful visualizations requires both technical skill and strategic thinking. An infographic design agency brings expertise in selecting appropriate chart types, scaling visualizations correctly, and avoiding common pitfalls that mislead or confuse audiences.
Choosing the Right Visualization Type
Different data types demand specific visualization approaches:
| Data Type | Recommended Visualization | Use Case |
|---|---|---|
| Trends over time | Line graphs, area charts | Stock performance, user growth |
| Part-to-whole relationships | Pie charts, donut charts | Market share, budget allocation |
| Comparisons | Bar charts, column charts | Product features, competitive analysis |
| Distributions | Histograms, box plots | Customer demographics, risk profiles |
| Relationships | Scatter plots, bubble charts | Correlation analysis, portfolio positioning |
The best practices for infographic layouts stress the importance of matching visualization type to data characteristics. Mismatched pairings create confusion rather than clarity.
For technology companies, visualizing system architectures, user flows, or performance metrics requires specialized approaches. Financial firms need precise representations of portfolio composition, risk exposure, or market trends. An experienced infographic design agency understands these industry-specific requirements, applying appropriate visualization strategies that resonate with target audiences.
Avoiding Common Data Visualization Errors
Even well-intentioned designers can fall into traps that distort data or mislead viewers. Professional agencies implement quality control measures to prevent:
- Truncated axes that exaggerate differences between data points
- 3D effects that distort proportions and complicate accurate reading
- Excessive chart elements that clutter rather than clarify
- Inconsistent scaling that prevents meaningful comparison
- Misleading baseline selection that skews interpretation
These errors prove particularly problematic in financial contexts where precise communication of performance data, risk metrics, or market conditions carries legal and ethical implications. Similarly, technology companies presenting user statistics, performance benchmarks, or security metrics must ensure accuracy to maintain credibility.
Strategic Application in Business Communications
An infographic design agency delivers value across multiple business communication scenarios. Understanding where infographics drive maximum impact helps organizations allocate resources effectively and achieve communication objectives.
Investor Relations and Pitch Materials
Financial and technology companies seeking funding face intense competition for investor attention. Infographics transform pitch decks from text-heavy documents into compelling visual narratives that communicate business models, market opportunities, and competitive advantages efficiently.
For firms developing fintech pitch decks, infographics can illustrate complex financial instruments, demonstrate market size, or visualize customer acquisition strategies. The visual approach helps non-technical investors grasp technological innovations while maintaining the professional credibility that financial stakeholders expect.
Elements commonly featured in investor-focused infographics include:
- Market size and growth trajectory visualizations
- Competitive landscape positioning maps
- Revenue model and unit economics illustrations
- Product roadmap timelines
- Customer testimonial and traction metrics
Internal Communications and Training
Beyond external communications, infographics serve powerful internal functions. Companies use them for employee onboarding, process documentation, policy communication, and training materials. Visual formats reduce training time and improve information retention compared to traditional text-based documentation.
Technology companies documenting complex systems benefit from process flow infographics that illustrate how components interact. Financial services firms use infographics to communicate compliance requirements, risk management protocols, or new product features to sales teams. This internal application often provides immediate return on investment through improved efficiency and reduced errors.

Industry-Specific Considerations for Financial and Tech Sectors
Working with an infographic design agency that understands your industry context accelerates the design process and improves outcomes. Financial services and technology sectors present unique challenges that require specialized knowledge.
Financial Services Visualization Challenges
Financial infographics must balance accessibility with technical accuracy. Oversimplification risks misrepresenting products or performance, while excessive complexity defeats the purpose of visual communication. Professional agencies navigate this balance by:
- Using precise terminology that maintains technical accuracy
- Providing appropriate context through footnotes or disclaimers
- Selecting timeframes and comparisons that fairly represent performance
- Adhering to regulatory requirements for financial communication
- Building trust through conservative, professional design approaches
For businesses managing tax planning strategies, partnering with specialized services like Taxt for financial optimization creates opportunities for infographics that communicate tax savings strategies or retirement planning frameworks to clients.
Technology Sector Communication Needs
Technology companies face different challenges, often needing to explain highly technical products to less technical audiences. An infographic design agency helps bridge this gap by:
- Translating technical specifications into benefit-focused visualizations
- Creating system architecture diagrams that communicate without overwhelming detail
- Illustrating user experience flows that demonstrate product value
- Visualizing performance metrics and benchmarks in accessible formats
- Developing security and compliance visualizations that build confidence
The infographic design process emphasizes understanding audience technical knowledge levels and calibrating complexity accordingly. A presentation designed for technical peers differs substantially from one targeting potential customers or investors.
Measuring Infographic Effectiveness
Professional agencies don't simply deliver attractive visuals; they create measurable communication tools. Understanding how to evaluate infographic performance ensures continuous improvement and validates design investments.
Quantitative Metrics
Digital infographics generate trackable engagement data:
| Metric | What It Measures | Optimization Insight |
|---|---|---|
| View duration | Time spent engaging with content | Indicates compelling vs. confusing design |
| Scroll depth | How far viewers progress through content | Reveals where engagement drops off |
| Click-through rates | Actions taken after viewing | Measures call-to-action effectiveness |
| Social shares | Audience amplification | Indicates perceived value and relevance |
| Download rates | Interest in preserving information | Suggests reference value |
These metrics help refine future infographic development, identifying which visualization approaches resonate most effectively with target audiences.
Qualitative Assessment
Beyond numbers, qualitative feedback provides crucial insights. Professional agencies gather input through:
- Stakeholder interviews assessing whether key messages were understood
- A/B testing comparing different design approaches with sample audiences
- Focus group feedback exploring emotional responses and comprehension
- Sales team input on how materials support customer conversations
- Customer questions revealing areas requiring clarification
This feedback loop ensures that infographic design continuously improves, addressing real communication challenges rather than pursuing aesthetically interesting but strategically ineffective approaches.
Selecting the Right Infographic Design Partner
Not all design agencies offer equivalent expertise. Organizations seeking maximum return on investment should evaluate potential partners carefully, considering factors beyond portfolio aesthetics.
Essential Evaluation Criteria
When selecting an infographic design agency, consider:
- Industry experience: Prior work with financial services or technology clients demonstrates understanding of sector-specific communication challenges
- Strategic approach: Agencies that emphasize discovery and strategy before design deliver better outcomes than those jumping directly to visual development
- Process transparency: Clear timelines, review stages, and revision policies prevent misunderstandings
- Technical capabilities: Proficiency with current design tools and delivery formats ensures compatibility with your systems
- Communication style: Responsive, collaborative partners facilitate smoother project execution
The six best practices for creating effective infographics include starting with a clear audience in mind, emphasizing the importance of agencies that prioritize audience understanding over design preferences.
Questions to Ask Prospective Agencies
Vetting conversations should explore:
- How do you approach data accuracy and verification?
- What is your typical timeline from concept to delivery?
- How many revision rounds are included in your pricing?
- Can you provide case studies from similar industries?
- What file formats and resolutions do you deliver?
- Do you offer ongoing support or updates after initial delivery?
These questions reveal whether an agency's working style aligns with your organizational needs and expectations. For companies already working with design partners for best PPT presentation development, evaluating whether those same partners can deliver infographic expertise often provides efficiency benefits.
Integration with Broader Visual Communication Strategy
An infographic design agency delivers maximum value when infographic development integrates with comprehensive visual communication strategies. Isolated infographics, however well-designed, cannot overcome inconsistent or fragmented brand presentation.
Creating Visual Consistency Across Platforms
Professional agencies ensure that infographics align with:
- Presentation templates and slide designs
- Website visual language and color schemes
- Social media graphics and digital marketing materials
- Print collateral and promotional materials
- Video content and motion graphics
This consistency reinforces brand recognition and creates professional cohesion across customer touchpoints. When developing materials for Figma slides or other presentation platforms, maintaining visual harmony between infographics and slide design strengthens overall communication impact.
Repurposing and Adaptation
Smart agencies design infographics with repurposing in mind, creating modular elements that adapt across multiple formats:
- Breaking comprehensive infographics into social media snippets
- Adapting static infographics for animated video content
- Reformatting vertical infographics for horizontal presentation slides
- Creating interactive versions of static infographics for web use
- Developing print versions of digital-first designs
This flexibility maximizes return on design investment, allowing single concepts to serve multiple communication channels without requiring complete redesign.
Emerging Trends Shaping Infographic Design
The infographic design landscape continues evolving as technology advances and audience expectations shift. An innovative infographic design agency stays current with emerging trends while avoiding fads that compromise communication effectiveness.
Interactive and Animated Infographics
Static images increasingly give way to interactive experiences that allow viewers to explore data at their own pace. Interactive infographics particularly benefit complex financial products or technical specifications where different audience segments need access to varying detail levels.
Animation adds another dimension, using motion to illustrate processes, demonstrate change over time, or guide viewer attention through sequential information. These approaches prove especially effective in digital presentations and web-based communications.
The five principles of great infographic design remain relevant regardless of format, emphasizing clear central ideas and data clarity as foundational regardless of interactive features.
Data-Driven Personalization
Advanced infographic systems now enable dynamic content that adapts based on viewer characteristics or inputs. Financial services firms might generate personalized infographics showing individual portfolio performance or retirement planning scenarios. Technology companies could create customized system diagrams based on specific implementation configurations.
This personalization increases relevance and engagement, making communications feel tailored rather than generic. However, it requires sophisticated technical infrastructure and careful design to maintain visual consistency across variations.
Partnering with an infographic design agency transforms how financial and technology companies communicate complex information, turning data overload into compelling visual narratives that drive understanding and action. Whether you're developing investor materials, client presentations, or internal communications, strategic visual design amplifies your message and differentiates your brand. Prznt Perfect specializes in transforming complex financial and technical concepts into visually stunning presentations and infographics that resonate with sophisticated audiences, combining strategic insight with design excellence to help you communicate with clarity and impact.


- This is some text inside of a div block.lay out the facts clearly and compellingly. Use data to establish the ground reality, but remember that facts alone are like the individual strands of a tapestry—necessary but not complete.lay out the facts clearly and compellingly. Use data to establish the ground reality, but remember that facts alone are like the individual strands of a tapestry—necessary but not complete.
- This is some text inside of a div block.lay out the facts clearly and compellingly. Use data to establish the ground reality, but remember that facts alone are like the individual strands of a tapestry—necessary but not complete.

