
8 Stunning Infographics PPT Templates for 2026 Presentations
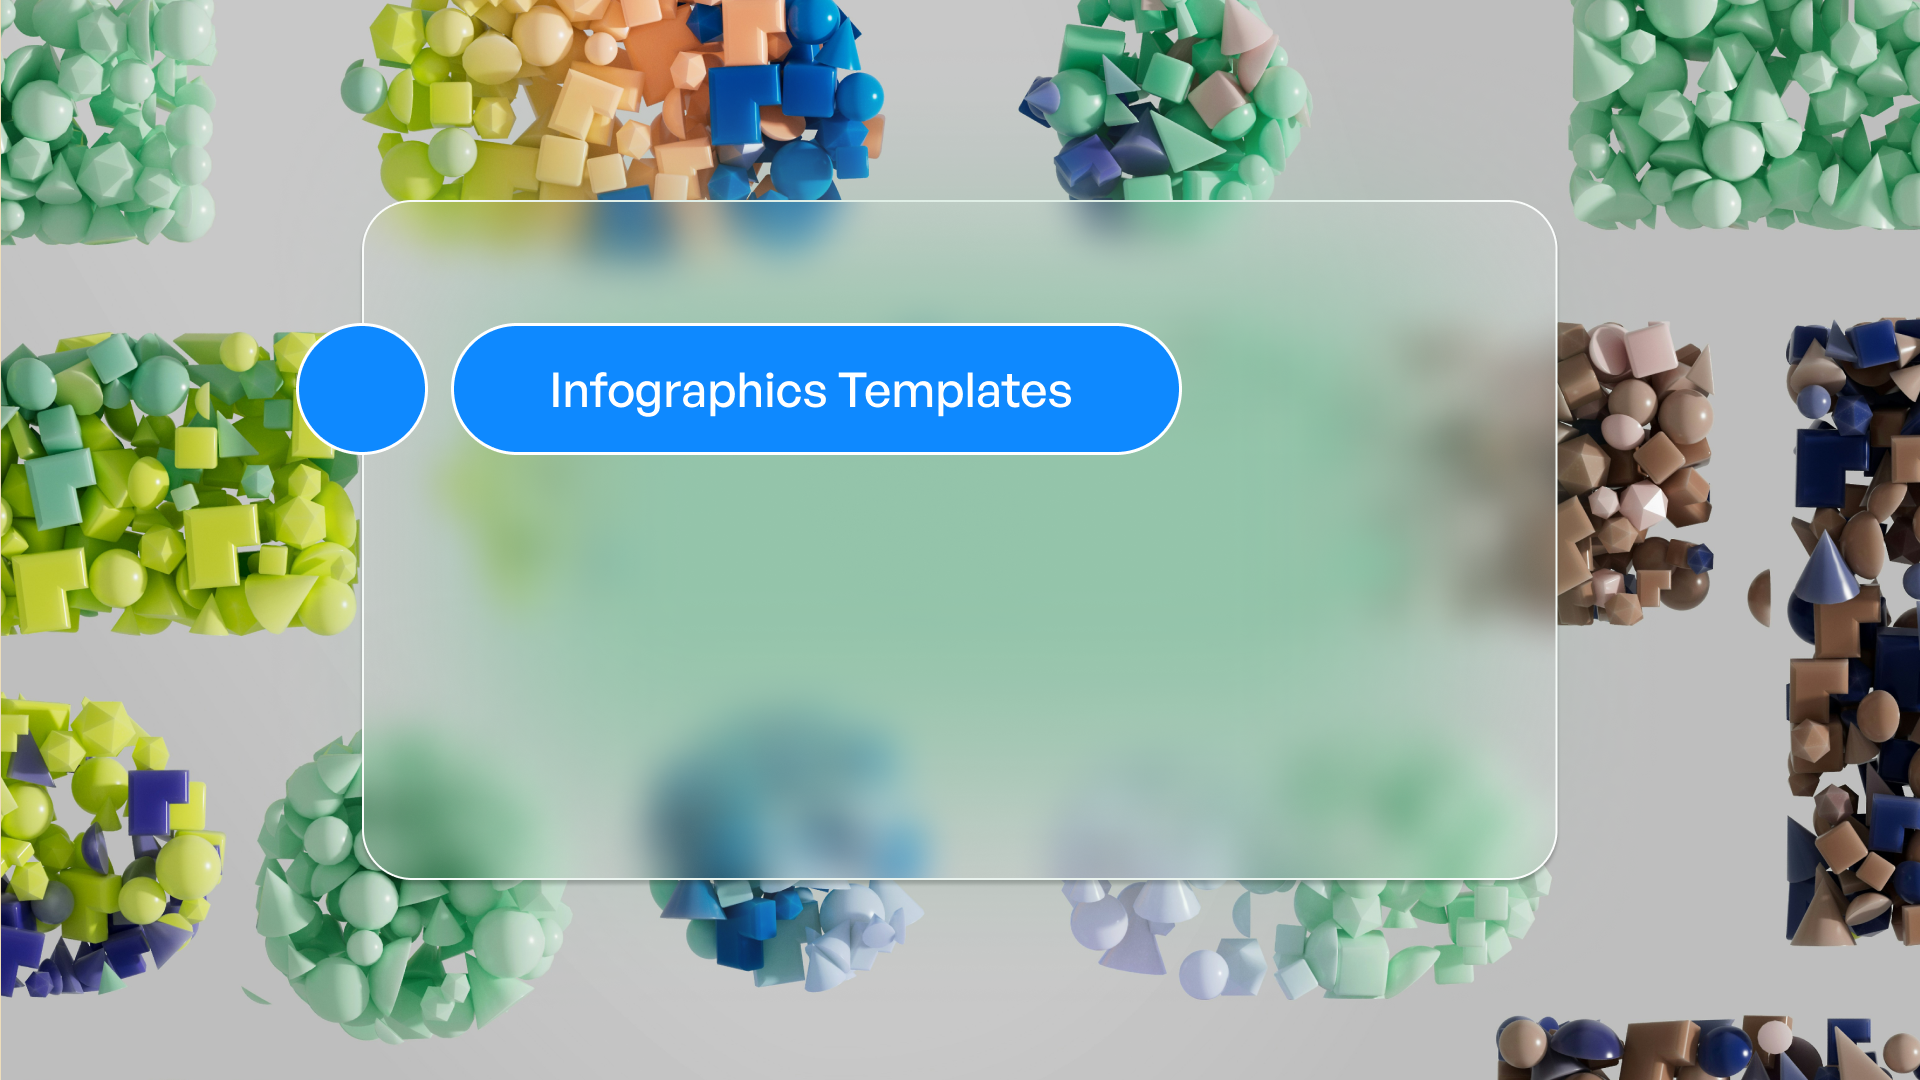
In today’s fast-paced digital world, infographics ppt are transforming how we communicate complex ideas in presentations. As attention spans shrink, visual storytelling and effective data visualization are now essential for holding your audience’s interest and boosting retention.
Ready to stand out in 2026? This article reveals 8 stunning Infographics PPT templates that can instantly elevate your next presentation. Discover the latest trends, innovative designs, and practical tools that make communication clearer and more compelling.
Explore top-rated templates, their unique features, pricing, ideal use cases, and real pros and cons—so you can confidently choose the best fit for your next big presentation.
The Rise of Infographics in 2026 Presentations
The landscape of presentations is evolving rapidly. As digital transformation accelerates, presenters are shifting away from dense, text-laden slides in favor of compelling visuals. This change is driven by the need to capture attention, clarify complex ideas, and deliver messages that resonate. Infographics ppt templates are now central to this movement, offering clear, engaging ways to present information that audiences can easily grasp and remember.
The Evolution of Presentation Design
Presentation design in 2026 has moved far beyond bullet points and static charts. Today, audiences expect clarity, brevity, and engagement from every slide. The infographics ppt trend reflects this shift, allowing presenters to transform dense data into visually appealing stories. Digital transformation and the rise of remote work have only amplified this need. In recent high-profile conferences, companies have used infographics ppt slides to distill complex strategies into memorable visuals, making information accessible to global audiences.
Why Infographics PPT Templates Are Essential
Infographics ppt templates are more than just decorative tools. They are proven to improve information retention by up to 80 percent, according to Infographics enhance information retention. By turning abstract data into clear visuals, these templates streamline communication for diverse audiences. They also save valuable preparation time and ensure design consistency, which is critical in competitive business and educational settings. Tech and finance sectors, for example, leverage infographics ppt to make quarterly results and forecasts instantly understandable.
Key Features to Look for in 2026 Infographics Templates
When choosing an infographics ppt template for 2026, compatibility is key. The best templates work seamlessly with PowerPoint, Google Slides, and Canva, making collaboration easy. Look for fully editable vector graphics and robust icon libraries to tailor each slide to your needs. Data-driven charts, timelines, and modern color schemes boost clarity and engagement. Accessibility, including mobile-friendly layouts and readable typography, ensures your infographics ppt communicates effectively with every audience.
Trends Shaping Infographics PPT Templates in 2026
The future of infographics ppt design is dynamic and inclusive. AI-powered customization offers smart design suggestions, helping users create stunning visuals with minimal effort. Animated infographics and real-time data integration add life and relevance to presentations. Minimalist, clean aesthetics dominate, while new templates increasingly feature DEI visuals and icons. These trends ensure infographics ppt templates remain at the forefront of effective communication, supporting presenters as they connect with diverse audiences.
8 Stunning Infographics PPT Templates for 2026
In 2026, presenters are seeking infographics ppt templates that combine visual impact with data clarity. The right template does more than decorate a slide, it transforms information into stories that stick. Whether you are pitching to investors, training teams, or leading strategy sessions, these eight infographics ppt options will help you communicate with confidence and style.
Project Management Infographics PPT by Slidequest
For project leaders, the Project Management Infographics PPT by Slidequest delivers an all-in-one solution. This infographics ppt template includes 16:9 HD slides, fully editable graphics, timelines, Gantt charts, and process flows. You can visualize project milestones, dependencies, and workflows with clarity.
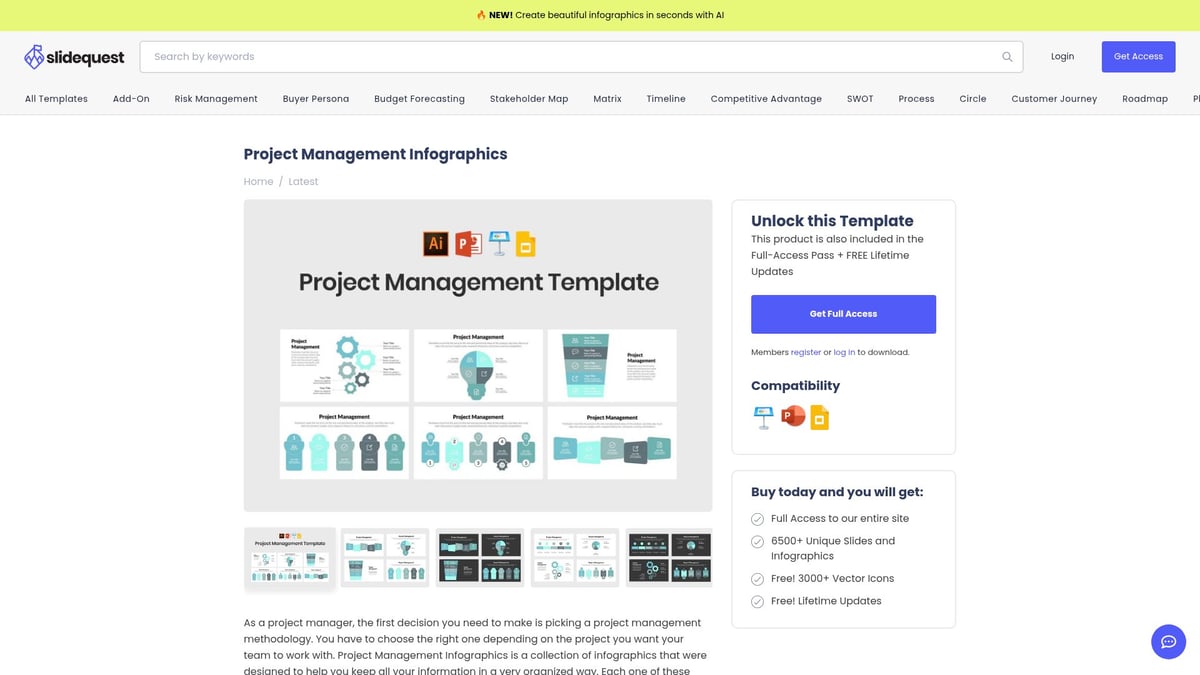
Pricing is included in the Slidequest Full-Access Pass, with individual rates varying. The template is a favorite among project managers, PMOs, and business consultants who need to track progress and share updates in a visually engaging way.
Key Benefits:
- Streamlines project tracking
- Offers a wide range of project visuals
- Ensures cross-platform compatibility
Pros:
- All-in-one toolkit for tech and business
- Editable for any project type
Cons:
- Best value requires a full-access pass
Unique Selling Point: Used by Fortune 500 teams for quarterly reviews, this infographics ppt helps deliver complex updates with visual precision. Interested in how infographics can clarify your message? Read more about using infographics for clarity.
Business Infographic Examples by SlideEgg
If you are building a business deck on a tight timeline, the Business Infographic Examples by SlideEgg offer a powerful infographics ppt resource. With 13 unique slides featuring business process diagrams, pie charts, and timelines, this template supports rapid visual storytelling.
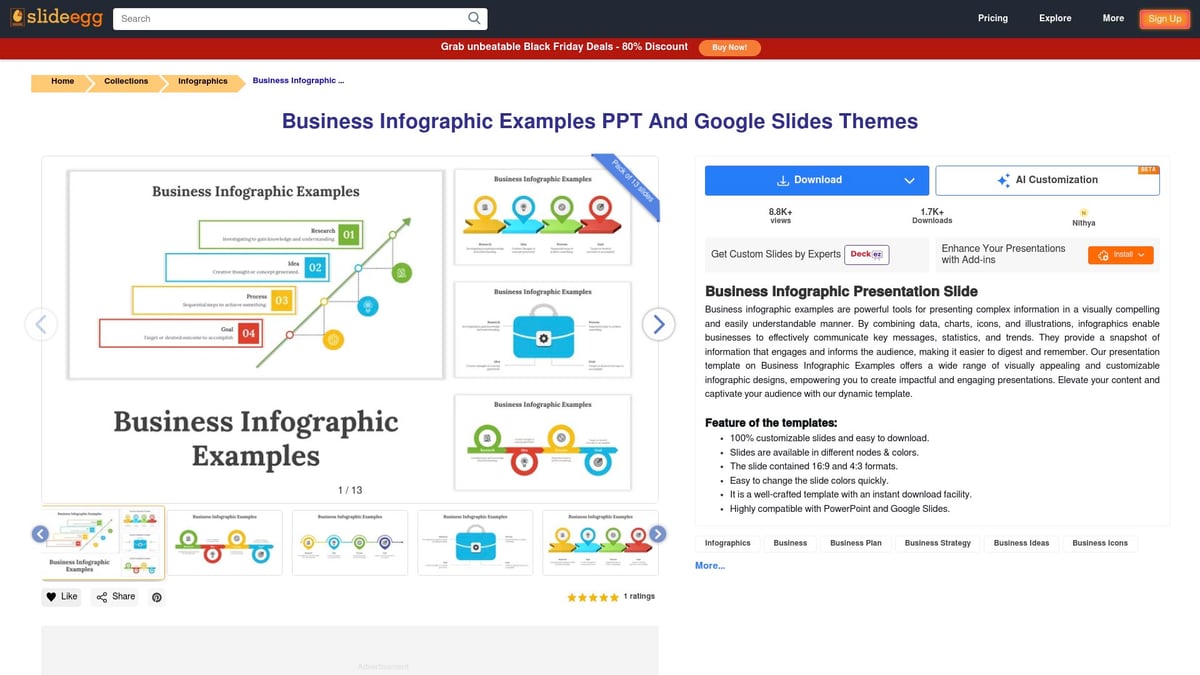
It is available as a free download, making it accessible for entrepreneurs, startups, and educators. The easy-to-edit format means you can quickly adapt each slide to suit your business narrative or teaching objectives.
Key Benefits:
- Free and easy to customize
- Suitable for multiple sectors
- Perfect for pitch decks
Pros:
- No cost, no barriers
- Clean, modern design
Cons:
- Limited advanced animation features
Unique Selling Point: Popular among startup founders for pitches, this infographics ppt template is ideal for conveying strategy and growth stories.
Funnel Infographics Template by Slidequest
Marketing and sales teams rely on clear visuals to communicate conversion strategies. The Funnel Infographics Template by Slidequest is crafted for this purpose, offering dedicated infographics ppt slides for funnel diagrams, conversion tracking, and lead generation visuals.
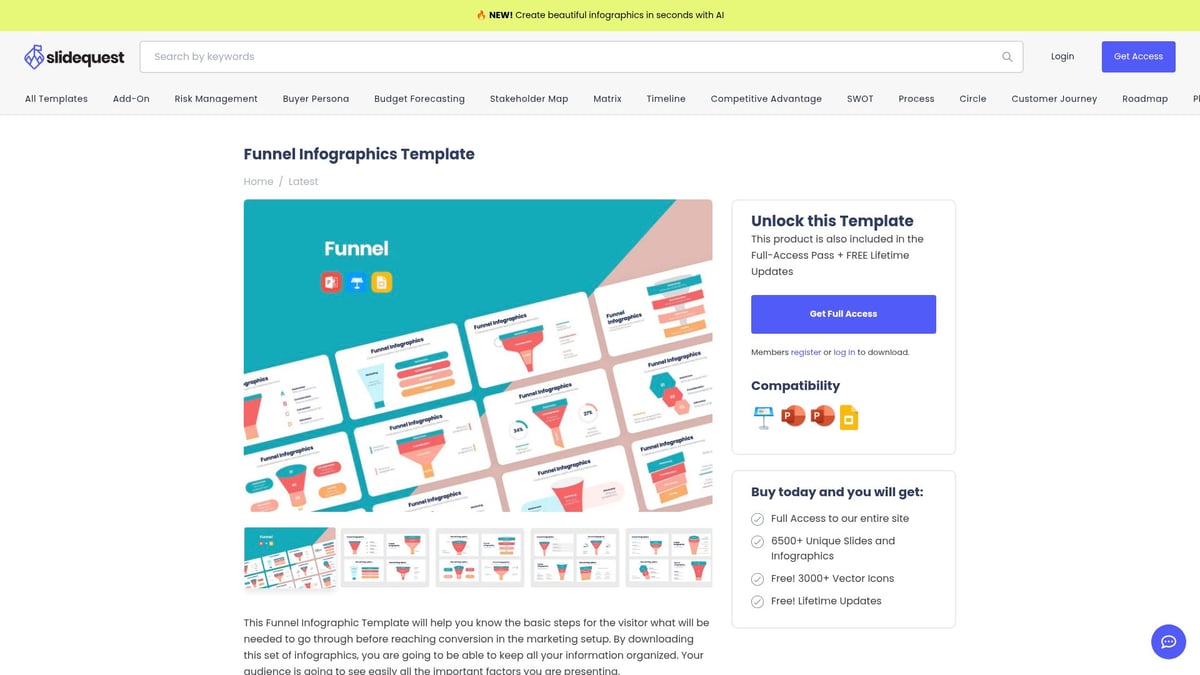
Access is included in the Slidequest Full-Access Pass. The template is highly editable, allowing marketers, sales teams, and business analysts to tailor visuals for their specific industry or campaign.
Key Benefits:
- Maps out marketing and sales funnels
- Clarifies conversion paths
- Accelerates strategy presentations
Pros:
- Professional funnel layouts
- Adaptable to any sector
Cons:
- Requires subscription for full access
Unique Selling Point: SaaS companies use this infographics ppt to showcase customer journeys and optimize conversion rates.
High Quality PowerPoint Presentations by SlideEgg
For those who need versatility, High Quality PowerPoint Presentations by SlideEgg provide a vibrant infographics ppt template. It features circular infographics, multi-color segment visuals, and a robust icon set for process, cycle, and team presentations.
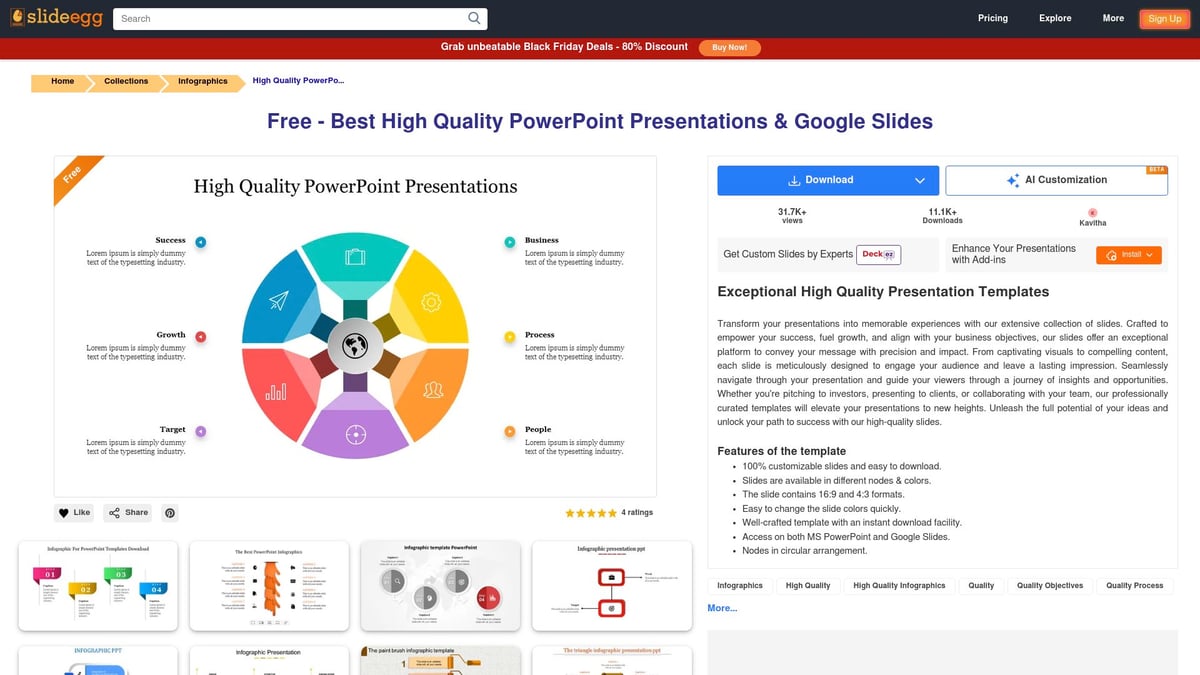
This template is free to download and is especially useful for corporate trainers, HR professionals, and educators. The design is bright and inviting, fostering engagement in both live and remote sessions.
Key Benefits:
- Versatile for various presentation types
- Easy to adapt with vibrant designs
- Supports onboarding and training
Pros:
- No cost to access
- Broad usability
Cons:
- May require manual animation for extra engagement
Unique Selling Point: Used in skills mapping and training workshops, this infographics ppt ensures every team member is aligned.
KPI Dashboards Infographics by Slidequest
Executives and analysts need precise data visuals. The KPI Dashboards Infographics by Slidequest deliver an infographics ppt template focused on dashboard layouts, key metric visualizations, and trend charts. You can highlight performance data in a way that is easy to digest and actionable.
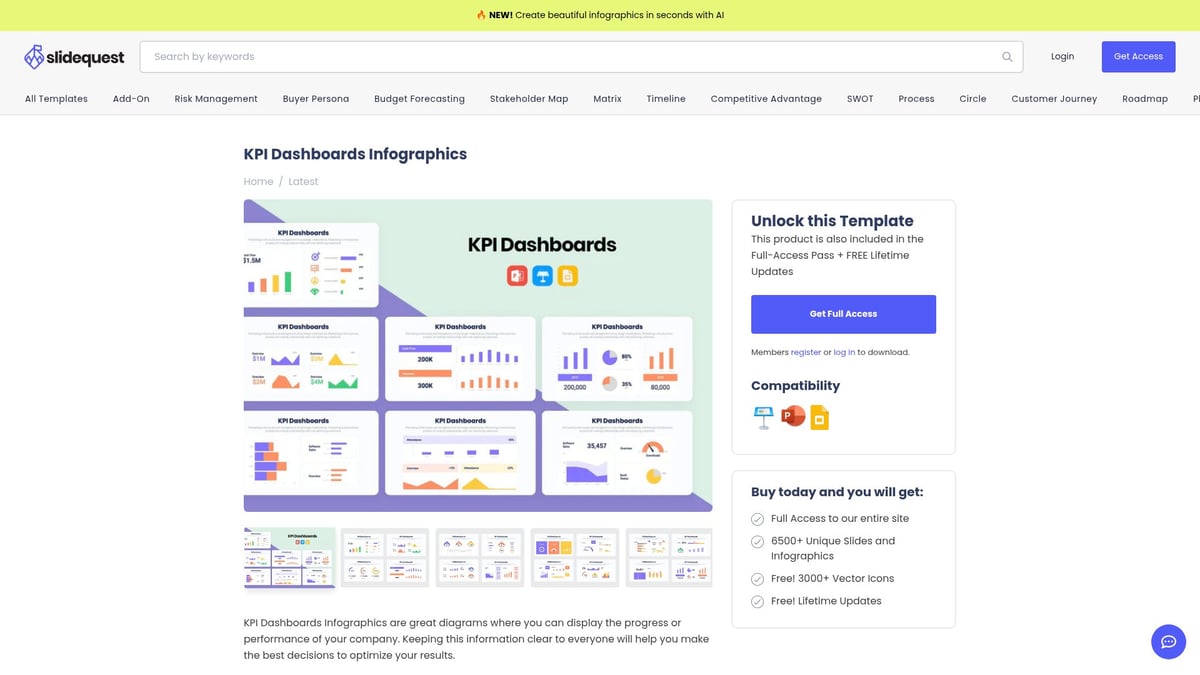
Available through a Slidequest subscription, this template is tailored for leadership meetings and operations reviews. Its clean, data-focused design ensures that critical metrics are front and center.
Key Benefits:
- Customizable metrics and charts
- Data-driven decision support
- Clean, professional layout
Pros:
- Focus on actionable insights
- Supports executive briefings
Cons:
- Best features are subscription-only
Unique Selling Point: Used in monthly executive briefings, this infographics ppt helps drive informed decisions at the highest level.
Creative Icebreaker PPT by SlideEgg
Kick off meetings with energy using the Creative Icebreaker PPT by SlideEgg. This infographics ppt template includes 16 slides filled with team-building infographics and interactive visuals designed to boost engagement from the start.
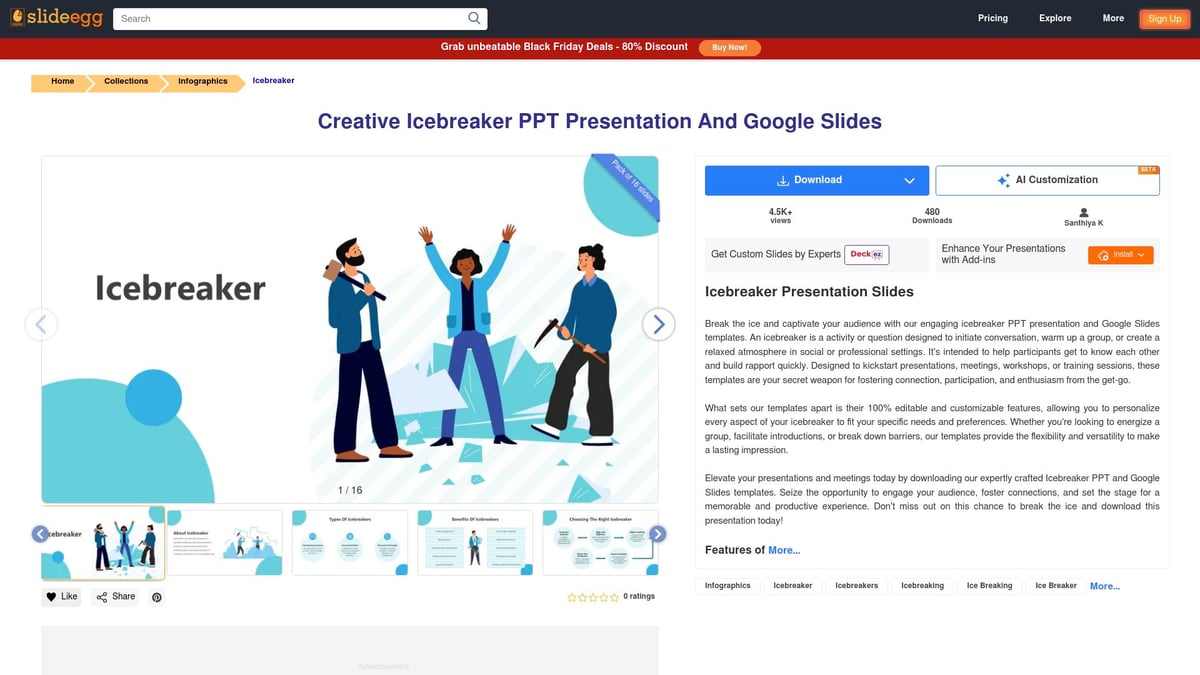
It is free to download and perfect for workshop facilitators, HR professionals, and educators. The playful layout is crafted for icebreakers, making any session more dynamic and memorable.
Key Benefits:
- Increases participant engagement
- Perfect for onboarding or team-building
- Easy to use and adapt
Pros:
- Free and interactive
- Encourages participation
Cons:
- Less suitable for formal business reporting
Unique Selling Point: HR teams use this infographics ppt in onboarding sessions to foster connection and collaboration.
Timeline Infographics Template by Slidequest
When you need to tell a chronological story, the Timeline Infographics Template by Slidequest excels. This infographics ppt template offers a variety of timeline styles, milestone markers, and editable date fields for visualizing project history, product launches, or roadmaps.
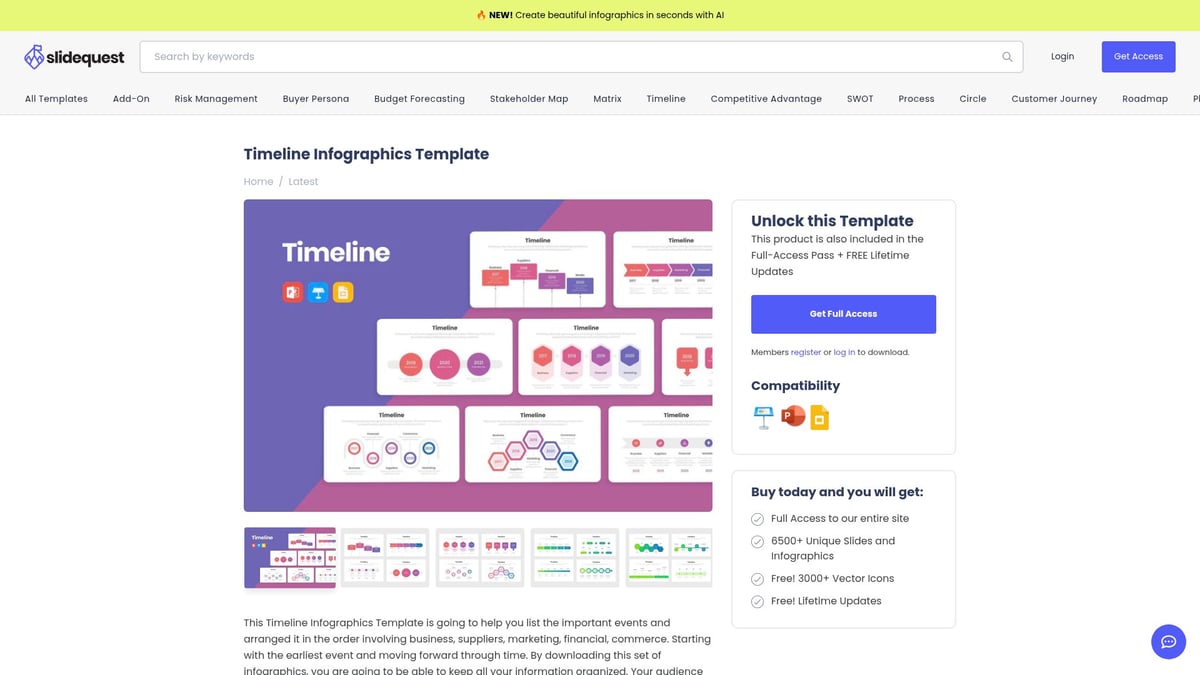
Access is provided via the Slidequest Full-Access Pass. Product managers, educators, and event planners appreciate the flexibility and ease of updating timelines to fit any scenario.
Key Benefits:
- Visualizes complex timelines clearly
- Multiple styles for different needs
- Simple to update and customize
Pros:
- Wide variety of timeline visuals
- Supports multiple use cases
Cons:
- Requires subscription for download
Unique Selling Point: Product teams use this infographics ppt for release planning, ensuring every stakeholder is on the same page.
Storytelling Infographics PPT by SlideEgg
To craft a compelling narrative, the Storytelling Infographics PPT by SlideEgg provides 36 slides of narrative-driven visuals and process diagrams. This infographics ppt template is built for persuasive presentations that need to connect emotionally and logically with audiences.
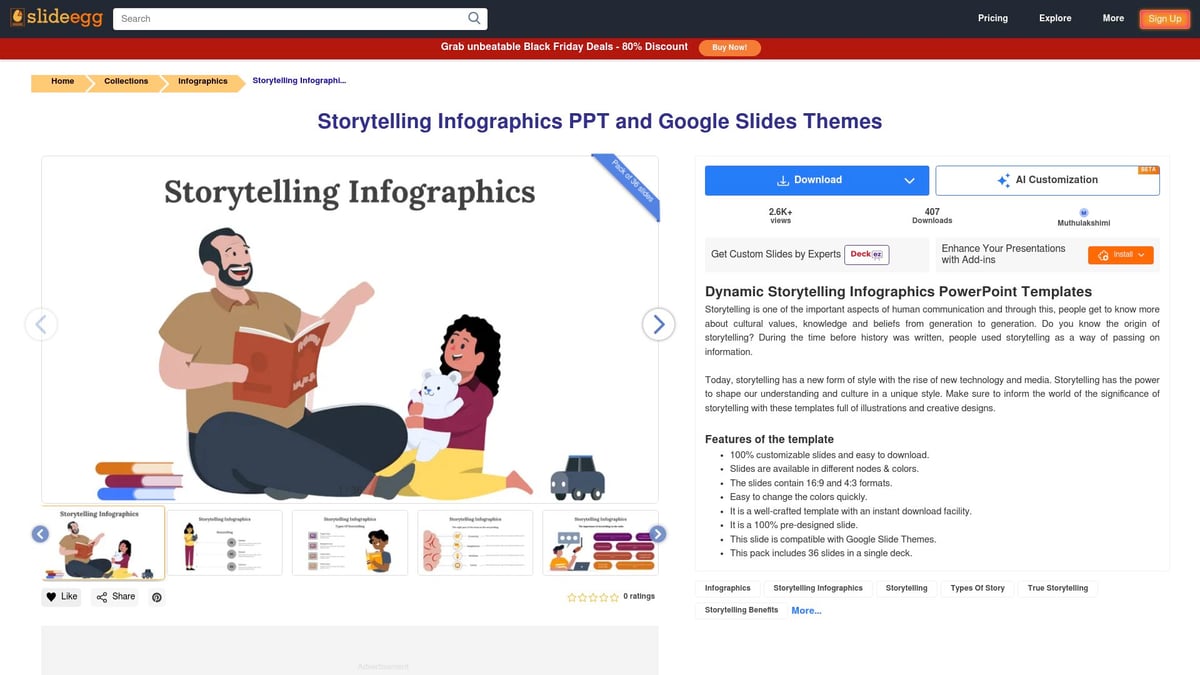
It is available as a free download, making it accessible for marketers, speakers, and educators. With extensive slide variety, you can illustrate customer journeys, brand stories, or educational processes with ease.
Key Benefits:
- Elevates presentations with strong story arcs
- Supports persuasive communication
- Easily adapted to various topics
Pros:
- Free and extensive in scope
- Built for narrative impact
Cons:
- May require adaptation for niche subjects
Unique Selling Point: Marketers use this infographics ppt in campaigns to illustrate customer journeys and drive engagement.
How to Choose the Right Infographics PPT Template for Your Needs
Selecting the best infographics ppt template for your presentation can transform how your message resonates with any audience. With so many options available, it is essential to align your choice with your specific goals, content, and audience expectations.
Assessing Your Presentation Goals
Begin by defining the primary objective of your infographics ppt. Are you aiming to inform, persuade, educate, or inspire? Each goal may require a different style or structure.
Match the template’s tone to your audience. Corporate teams often expect clean, data-focused visuals, while creative or academic groups may prefer more dynamic, colorful designs. Map out the critical data points and stories you need to visualize. Consider your brand's color palette and logo placement for consistency.
For more guidance on how visual frameworks help break down complex topics, see how experts are simplifying complex data visually to improve clarity and impact.
Evaluating Template Features and Flexibility
When evaluating an infographics ppt template, prioritize full editability and vector support. This ensures you can adjust diagrams, icons, and charts without losing quality. Confirm compatibility with your preferred platform, whether that is PowerPoint, Google Slides, or Canva.
Look for modular layouts, which allow you to rearrange sections, and robust icon libraries for added flexibility. Templates with a variety of data visualization options, such as timelines, funnels, and dashboards, offer more ways to communicate your message clearly.
Compare features in a table to simplify decision-making:
| Feature | Importance | Example Use Case |
|---|---|---|
| Editable vectors | High | Customizing icons |
| Platform compatibility | Essential | Google Slides users |
| Modular layouts | High | Rearranging slides |
Choosing the right infographics ppt can save time and elevate your presentation’s professionalism.
Comparing Pricing and Licensing Models
Pricing and licensing are crucial when selecting an infographics ppt template. Free templates are attractive for personal or educational projects, but subscription-based options often provide greater variety, premium design, and ongoing updates.
Review whether bundled packages offer better value than single downloads. Check the licensing terms to ensure compliance for commercial use. Some providers offer support and regular updates, which can be vital for frequent presenters.
For instance, Slidequest’s Full-Access Pass grants access to a wide library, while SlideEgg offers high-quality free downloads. Weigh these options based on your budget, frequency of use, and the importance of advanced features.
Real-World Use Cases and Success Stories
Real-world examples highlight the impact of choosing the right infographics ppt. Businesses have improved engagement and clarity by visualizing KPIs, processes, and customer journeys. Academic presenters report higher retention rates when using visuals.
Marketing teams leverage funnel and storytelling templates for campaign success, while trainers use interactive visuals to boost participation. In fact, interactive infographics boost engagement and information retention, making them valuable for webinars and remote meetings.
Selecting the right infographics ppt is not just about design, but about achieving measurable results in every presentation.
Expert Tips for Maximizing Impact with Infographics PPT Templates
Unlocking the full potential of your infographics ppt requires more than just choosing an attractive template. Strategic design, thoughtful customization, and interactive elements all play a crucial role in making your message memorable. Below, explore expert tips that will help you elevate your presentations in 2026 and beyond.
Design Best Practices for 2026 Presentations
To maximize clarity and engagement with your infographics ppt, focus on strong visual hierarchy. Use headings, subheadings, and highlighted data points to guide your audience’s eye. Consistent color schemes and font choices will reinforce your message and avoid distractions.
Limit text on each slide, prioritizing concise data and supporting visuals. White space is your ally for readability, making complex ideas easier to digest. Before-and-after slide comparisons can help you see the difference a clean, modern design makes.
For inspiration, explore visual storytelling in presentations to see how compelling visuals improve retention and audience connection.
Customizing Templates for Brand Consistency
Brand consistency is essential when using an infographics ppt. Integrate your company’s color palette, logo, and fonts throughout the template. This ensures your presentation aligns with established branding and feels cohesive.
Adapt iconography and imagery to reflect your organization’s values and culture. Choose icons that resonate with your industry, whether it’s finance, tech, or education. Prioritize accessibility by maintaining high contrast, readable font sizes, and accessible color choices.
Personalizing your infographics ppt in these ways not only strengthens your brand identity but also builds trust with your audience. Consistency across all slides reinforces professionalism and credibility.
Incorporating Animation and Interactivity
Modern infographics ppt templates offer powerful tools for animation and interactivity. Subtle transitions can guide attention to key points, while interactive charts and clickable icons make data exploration engaging.
Animated timelines and process diagrams add movement and context, enhancing storytelling. However, balance is key: overusing transitions can reduce professionalism and distract from your core message.
Stay ahead by adopting elements from top infographic design trends for 2025, such as minimalist motion and real-time data integration. These features keep your infographics ppt fresh and relevant in 2026.
Common Mistakes to Avoid
Even the best infographics ppt can fall short if common pitfalls are not addressed. Avoid overcrowding slides with excessive data or visuals. Each slide should communicate a single idea clearly.
Maintain a consistent visual style across all slides to prevent confusion. Test your infographics ppt on different devices to ensure mobile and remote users have a seamless experience.
Neglecting accessibility or skipping a final review can undermine your hard work. By steering clear of these mistakes, your infographics ppt will deliver maximum impact and keep your audience engaged from start to finish.


- This is some text inside of a div block.lay out the facts clearly and compellingly. Use data to establish the ground reality, but remember that facts alone are like the individual strands of a tapestry—necessary but not complete.lay out the facts clearly and compellingly. Use data to establish the ground reality, but remember that facts alone are like the individual strands of a tapestry—necessary but not complete.
- This is some text inside of a div block.lay out the facts clearly and compellingly. Use data to establish the ground reality, but remember that facts alone are like the individual strands of a tapestry—necessary but not complete.

