How to Design a Semiconductor Product Infographic

Semiconductor products represent some of the most complex technology in modern business, combining intricate architectures, nanometer-scale manufacturing processes, and performance metrics that challenge even technical audiences. When you need to communicate chip specifications, process nodes, or system architectures to investors, customers, or internal stakeholders, learning how to design a semiconductor product infographic becomes essential. The right infographic transforms dense technical data into a visual narrative that resonates with decision-makers while maintaining engineering accuracy.

Understanding Your Semiconductor Infographic Audience

The first step in designing an effective semiconductor infographic requires identifying exactly who will consume this information. Technical stakeholders such as engineers and product managers need precision and detail, while executives and investors prioritize business impact and competitive positioning. Your design choices must bridge these different information needs without oversimplifying critical specifications or overwhelming non-technical viewers.

Segmenting Technical Versus Business Viewers

Different audience segments extract different value from semiconductor infographics. Engineers scrutinize transistor counts, power consumption figures, and thermal design parameters. Business leaders focus on market differentiation, total cost of ownership, and time-to-market advantages. When considering how to design a semiconductor product infographic, build information layers that serve both groups simultaneously.

Key audience considerations include:

  • Technical depth required: Determine whether viewers need gate-level detail or system-block overview
  • Domain expertise: Assess familiarity with semiconductor terminology and notation standards
  • Decision authority: Identify who approves purchases, investments, or design wins
  • Time constraints: Recognize that C-suite audiences may spend 30 seconds while engineers study for minutes

Create viewer personas before beginning layout work. Document their questions, pain points, and success metrics. This foundation ensures your infographic addresses real information needs rather than simply displaying available data.

Audience segmentation for semiconductor infographics

Structuring Information Hierarchy for Complex Products

Semiconductor products contain dozens of specifications across multiple categories: performance, power, connectivity, manufacturing, and packaging. Establishing clear information hierarchy prevents cognitive overload and guides viewers through your intended narrative. The MIT Communication Lab's figure-design guidance offers valuable principles for organizing technical information that apply directly to semiconductor infographics.

Building the Primary Message Framework

Every semiconductor infographic needs one dominant message that anchors the entire visual. This might be "30% higher performance per watt than competing solutions" or "first 3nm process node for automotive applications." Secondary information supports this claim through evidence and context.

Structure your hierarchy in three distinct tiers:

  1. Primary message: The single most important takeaway, typically occupying 20-30% of visual space
  2. Supporting evidence: Specifications, benchmarks, or architectural features that validate the primary claim
  3. Contextual details: Manufacturing process, package options, compliance certifications, and availability

Position the primary message in the upper-left quadrant for Western audiences, utilizing the natural F-pattern reading flow. Supporting evidence should follow logical relationships rather than arbitrary groupings. For example, cluster all power-related specifications together rather than scattering them across the layout.

Applying Progressive Disclosure Techniques

Not every viewer needs every specification simultaneously. Progressive disclosure allows you to present overview information immediately while making detailed specifications available through visual cues. Use expandable sections, annotated callouts, or supplementary reference tables positioned at the infographic's periphery.

When explaining how to design a semiconductor product infographic for presentation decks, consider that slides advance sequentially. Your infographic can introduce basic architecture first, then reveal performance metrics, and finally show competitive positioning across three successive slides rather than cramming everything into one overwhelming visual.

Choosing Appropriate Visual Formats for Semiconductor Data

Different semiconductor characteristics demand different visualization approaches. Clock speeds and bandwidth suit line graphs showing progression across generations. Transistor density works well with area charts or proportional squares. Architecture requires block diagrams with hierarchical relationships clearly defined.

Matching Data Types to Chart Forms

Data Category Recommended Visualization Rationale
Performance benchmarks Horizontal bar charts Easy comparison across competitors
Power consumption curves Line graphs with dual axes Shows voltage/frequency relationships
Die architecture Annotated block diagrams Reveals functional unit placement
Process node evolution Timeline or step diagrams Communicates technology roadmap
Market positioning Quadrant charts (Gartner-style) Shows competitive differentiation

Avoid pie charts for semiconductor data. Specifications rarely represent parts of a whole, and pie charts introduce unnecessary cognitive load when comparing similar values. Similarly, 3D charts add visual complexity without improving comprehension for technical audiences who expect engineering precision.

Semiconductor data visualization types

Creating Effective Block Diagrams

Block diagrams form the foundation of semiconductor architecture visualization. Each block represents a functional unit (CPU cores, GPU clusters, memory controllers, I/O interfaces), while connecting lines show data paths and hierarchical relationships. When considering how to design a semiconductor product infographic featuring chip architecture, follow industry-standard notation to maintain credibility with engineering audiences.

Best practices for semiconductor block diagrams:

  • Use consistent block sizing to indicate relative die area or processing capacity
  • Apply directional arrows showing data flow rather than simple connecting lines
  • Label interfaces with industry-standard protocols (PCIe 5.0, DDR5, USB4)
  • Include bandwidth annotations on critical paths
  • Distinguish on-chip versus off-chip components through border styling or shading

The ISA standards for instrumentation symbols provide authoritative guidance for process and system diagrams that semiconductor professionals recognize, particularly when visualizing manufacturing flow or test configurations.

Implementing Technical Accuracy and Standards Compliance

Semiconductor infographics presented to technical audiences must adhere to established notation, units, and measurement standards. Errors in unit prefixes, incorrect power-of-two versus power-of-ten distinctions, or non-standard terminology immediately undermine credibility regardless of visual appeal.

Maintaining Engineering Precision

Use IEEE-approved terminology and abbreviations throughout your infographic. Memory capacity uses binary prefixes (GiB, MiB) while network bandwidth uses decimal prefixes (Gb/s, Mb/s). Clock frequencies appear in GHz or MHz, never "gigahertz per second" or similar constructions that reveal unfamiliarity with semiconductor metrics.

The IEEE Author Center guidance for technical graphics emphasizes resolution requirements and labeling legibility that apply equally to infographics destined for presentations, datasheets, or marketing materials. Ensure all text remains readable when the infographic scales to different display sizes.

Verifying Specification Accuracy

Every number, every claim, and every comparison in your semiconductor infographic requires verification against source documentation. Reference:

  • Official product datasheets and specification sheets
  • Published benchmark results from recognized testing authorities
  • Peer-reviewed technical papers for novel architectures or processes
  • Competitive intelligence verified through multiple independent sources

Build a specification reference table during the design process that links each visual element to its authoritative source. This documentation proves invaluable when stakeholders question particular claims or request additional detail. Professional agencies understand this requirement; businesses looking to hire their first graphic designer should emphasize technical verification skills alongside design capability.

Optimizing Color and Contrast for Technical Communication

Color serves multiple purposes in semiconductor infographics: differentiating functional blocks, encoding performance levels, highlighting competitive advantages, and maintaining brand identity. However, color choices must prioritize accessibility and legibility for audiences that may include colorblind viewers or those viewing printed materials.

Selecting Accessible Color Palettes

Approximately 8% of men and 0.5% of women have some form of color vision deficiency. Your semiconductor infographic must communicate effectively regardless of how viewers perceive color. The W3C guidance on contrast and accessibility establishes minimum contrast ratios that ensure text and important graphical elements remain distinguishable.

Apply these accessibility principles:

  • Achieve minimum 7:1 contrast ratio for body text and critical specifications
  • Never rely solely on color to distinguish between different chip variants or performance tiers
  • Supplement color coding with patterns, textures, or shape variations
  • Test designs using colorblindness simulation tools before finalizing
  • Provide alternative encodings such as labels or icons alongside color differences

The Section 508 guidance on accessible color usage offers practical checklists particularly valuable when designing infographics for government contractors or regulated industries where accessibility compliance carries legal requirements.

Establishing Functional Color Mapping

Semiconductor professionals expect certain color conventions. Heat maps typically progress from blue (cool/low) through yellow to red (hot/high). Power states often use green for active, amber for standby, and red for thermal limits. Architecture diagrams frequently employ blue tones for compute, green for memory, and orange for I/O functions.

When explaining how to design a semiconductor product infographic that resonates with industry veterans, respect these implicit conventions while ensuring your palette remains distinctive enough to reinforce brand identity. Document your color system in a style guide that maintains consistency across multiple infographics and related presentation materials.

Incorporating Brand Identity Without Compromising Clarity

Semiconductor companies invest heavily in brand development, from logo refinement to proprietary color schemes and typography systems. Your infographic must balance brand expression with the functional requirements of technical communication. Overly aggressive branding obscures information; insufficient branding fails to differentiate your product in crowded markets.

Integrating Visual Identity Elements

Apply brand elements strategically rather than uniformly. Reserve your primary brand color for the most important specification or competitive advantage rather than applying it to every block in an architecture diagram. Use brand typography for headlines and callouts while selecting highly legible technical fonts for specification tables and detailed annotations.

Brand Element Primary Application Secondary Application Avoid Using For
Logo Header/footer placement Watermark at 20% opacity Repeated throughout diagram
Brand colors Key differentiators, CTA Section headers, borders All functional blocks
Proprietary fonts Headlines, product names Supporting text if highly legible Dense specification tables
Graphic motifs Backgrounds, dividers Icon accents Critical data visualization

The Carnegie Mellon data visualization guidelines demonstrate how academic institutions balance institutional branding with technical communication requirements, offering useful models for corporate semiconductor visualization.

Brand integration in semiconductor infographics

Designing for Multiple Distribution Channels

A semiconductor product infographic rarely serves just one purpose. The same visual might appear in investor pitch decks, on product pages, in sales presentations, at trade show booths, and in technical documentation. Each channel imposes different constraints on dimensions, resolution, file format, and information density.

Adapting Layouts for Different Contexts

Create a master infographic at the highest resolution and detail level required, then develop channel-specific variants rather than attempting a one-size-fits-all approach. Presentation slides demand landscape orientation optimized for 16:9 displays. Datasheets may require portrait orientation with print-friendly dimensions. Social media needs square or vertical formats with enlarged text legible on mobile screens.

When teaching teams how to design a semiconductor product infographic system, establish these format specifications upfront:

  1. Pitch deck version: 1920×1080px landscape, simplified for 30-second comprehension, emphasis on competitive differentiation
  2. Technical datasheet: 8.5×11" portrait, comprehensive specifications, print-optimized at 300 DPI minimum
  3. Trade show poster: 36×48" vertical, maximum visual impact from 10 feet, minimal dense text
  4. Website version: Responsive width, progressive disclosure via hover states or expandable sections
  5. Social media variant: 1080×1080px square, standalone comprehension without surrounding context

Similar to how biotech pitch deck examples demonstrate adaptation across fundraising stages, semiconductor infographics must flex across technical and business contexts while maintaining core messaging consistency.

Optimizing File Formats and Resolution

Technical audiences often zoom into infographics to examine specific details. Vector formats (SVG, AI, PDF) allow infinite scaling without quality loss, making them ideal for architecture diagrams and charts. Raster formats (PNG, JPG) require sufficient resolution to remain legible when magnified but small enough file sizes for web delivery and email distribution.

Export multiple versions:

  • Vector PDF: Master file for print production and high-resolution display
  • High-res PNG (300 DPI): Print-ready raster when vector editing isn't available
  • Web-optimized PNG (72-96 DPI): Balance between quality and load time for digital channels
  • Compressed JPG: Email attachments and content management systems with file size limits

Test exported files on actual target devices and platforms. An infographic that looks crisp on a 27-inch monitor may become illegible on a smartphone or when printed in a proposal document.

Balancing Innovation with Comprehension

Semiconductor technology evolves rapidly, introducing new architectures, packaging techniques, and performance metrics that lack established visualization conventions. When communicating novel concepts, designers face tension between innovative visual approaches that capture attention and familiar formats that ensure immediate comprehension.

Introducing Novel Visual Metaphors Carefully

Cutting-edge semiconductor products may require new visualization approaches. Chiplet architectures benefit from exploded-view 3D renderings showing how individual dies connect. Heterogeneous integration might use layered transparency to reveal stacking configurations. Advanced packaging demands cutaway views exposing internal structures.

Introduce unfamiliar visual formats gradually with supporting annotations that bridge to known concepts. If your chip pioneered a new interconnect technology, show it using standard block-diagram notation first, then reveal the innovative aspect through a detailed callout or supplementary view.

The NCES Forum Guide to Data Visualization emphasizes audience-first design and minimizing jargon, principles that apply when semiconductor infographics address audiences beyond core engineering teams.

Testing Comprehension Before Broad Distribution

Before finalizing a semiconductor infographic for investor presentations or product launches, conduct comprehension testing with representative audience members. Show the infographic for 60 seconds, remove it, then ask viewers to recall the primary message and two supporting details.

Effective infographics achieve 80%+ accuracy on primary message recall and 60%+ on supporting details. Lower performance indicates excessive complexity, unclear hierarchy, or competing visual elements that fragment attention. Iterate based on testing feedback, simplifying or reorganizing until comprehension targets are met.

Annotating Technical Details Effectively

Semiconductor specifications contain nuances that single numbers cannot capture. A "boost clock" of 5.2 GHz means something different depending on thermal conditions, power limits, and workload characteristics. Effective annotation provides essential context without cluttering the primary visual.

Layering Contextual Information

Use these annotation techniques strategically:

  • Asterisks and footnotes: Reference conditions, measurement methodologies, or qualifications
  • Callout boxes: Highlight specific architectural innovations or competitive advantages
  • Hover states (digital): Reveal additional specifications on mouseover without permanently consuming space
  • QR codes (print): Link to detailed specifications, benchmark data, or video explanations
  • Reference numbers: Connect visual elements to comprehensive specification tables

Position annotations near their referenced elements rather than collecting them in a separate legend that forces viewers to repeatedly shift focus. When space constraints prevent direct annotation, use subtle leader lines or numbered indicators that create clear visual connections.

Writing Clear, Concise Labels

Every label in a semiconductor infographic competes for limited attention. Write labels that communicate precisely without unnecessary words. "8-Core CPU Cluster" conveys the same information as "Central Processing Unit with Eight Independent Cores" in one-third the space.

Abbreviate according to industry standards but define uncommon acronyms on first use. While semiconductor engineers immediately recognize "FOVEROS" or "CoWoS" as Intel and TSMC advanced packaging brands respectively, business audiences may not. Brief parenthetical expansions ("FOVEROS (3D die stacking)") bridge knowledge gaps without patronizing technical viewers.

Leveraging Professional Design Resources

Complex semiconductor infographics demand expertise beyond basic presentation software. While platforms offer starting points, sophisticated visualizations require professional design tools and technical illustration skills. Understanding when to engage specialists versus handling projects internally significantly impacts both quality and efficiency.

Recognizing When to Engage Design Specialists

Simple specification comparisons or basic architecture diagrams may suit internal development using standard templates. However, investor-facing materials, product launch infographics, or technically complex visualizations benefit from professional design expertise. Agencies like Prznt Perfect specialize in transforming technical complexity into compelling visual narratives that resonate with both technical and business audiences.

Consider professional design services when:

  • Infographics will influence major investment or purchasing decisions
  • Products introduce novel technologies requiring custom visualization approaches
  • Deadlines are tight and internal resources lack capacity
  • Multiple variants are needed across diverse distribution channels
  • Brand consistency across extensive marketing materials is critical

The investment in professional design typically returns multiples through improved deal closure rates, reduced sales cycle length, and enhanced market positioning versus competitors using generic visualization approaches.

Building Internal Capability Strategically

Organizations producing frequent semiconductor infographics benefit from developing internal design capability while engaging specialists for flagship projects. Train technical marketing staff in fundamental visualization principles, establish template libraries for common diagram types, and create style guides ensuring consistency.

The visualization research on communication guidelines offers academic rigor useful when building institutional knowledge around technical visualization. Combine such research-backed principles with practical experience to elevate internal team capabilities over time.

Measuring Infographic Effectiveness

Unlike presentation decks where engagement metrics come from pitch outcomes, standalone infographics require different effectiveness measures. Track how semiconductor product infographics contribute to broader marketing and sales objectives through both quantitative metrics and qualitative feedback.

Establishing Performance Indicators

Define success metrics before deploying infographics across channels:

  • Engagement duration: Time spent viewing digital infographics (target: 90+ seconds for comprehensive designs)
  • Download rates: How frequently technical documentation including infographics gets saved
  • Sales cycle impact: Changes in time-to-close for opportunities supported by new infographics
  • Competitive win rates: Percentage of competitive evaluations won when infographics are presented
  • Support ticket reduction: Decreased technical inquiries about specifications after infographic deployment

Digital distribution enables detailed analytics. Monitor scroll depth, zoom interactions, and clickthrough rates on linked specifications. A/B test alternative layouts, color schemes, or information hierarchies to optimize performance empirically rather than relying solely on design intuition.

Gathering Stakeholder Feedback

Quantitative metrics reveal engagement patterns but not comprehension quality. Supplement analytics with structured feedback from sales teams, customers, and technical evaluators. Ask specific questions:

  1. What primary message did you take from this infographic?
  2. Which specifications or features stood out most prominently?
  3. What additional information would have been valuable?
  4. How did this visualization compare to competitor materials?
  5. Would you share this infographic with colleagues or decision-makers?

Iterate based on patterns in responses. If multiple viewers mention confusion about the same element, redesign that component. If a particular feature consistently goes unnoticed despite its importance, increase its visual prominence or introduce directional cues guiding attention.


Mastering how to design a semiconductor product infographic transforms complex technical specifications into strategic communication assets that accelerate deals, educate stakeholders, and differentiate products in competitive markets. The principles of audience segmentation, information hierarchy, visual format selection, technical accuracy, accessible design, and multi-channel optimization combine to create infographics that serve both engineering precision and business impact. Whether you're developing internal capabilities or seeking expert support, Prznt Perfect brings deep expertise in translating technical complexity into compelling visual narratives that resonate with financial and technology audiences, helping your semiconductor innovations achieve the market recognition they deserve.

We offer free 30-min consultation on the presentation design audit
and hiring the right visual 
comms professional, let’s talk!
Shedule a call
Shedule a call
"I understand" goes a step further into the cognitive dance of persuasion. It's where the audience begins to see the connections between the facts, to grasp the nuances of the problem and the elegance of the solution.
  • This is some text inside of a div block.
    lay out the facts clearly and compellingly. Use data to establish the ground reality, but remember that facts alone are like the individual strands of a tapestry—necessary but not complete.
    lay out the facts clearly and compellingly. Use data to establish the ground reality, but remember that facts alone are like the individual strands of a tapestry—necessary but not complete.
  • This is some text inside of a div block.
    lay out the facts clearly and compellingly. Use data to establish the ground reality, but remember that facts alone are like the individual strands of a tapestry—necessary but not complete.

We offer free 30-min consultation on the presentation design audit

and hiring the right visual 
comms professional, let’s talk!

Shedule a call

"I understand" goes a step further into the cognitive dance of persuasion. It's where the audience begins to see the connections between the facts, to grasp the nuances of the problem and the elegance of the solution.

  • - 1 -
    Consistency at Scale:

    Biotech Market Trends 2024: Tailoring Your Pitch Deck to Current Industry Dynamics.

  • - 2 -
    Efficiency and Speed:

    The traditional process of manually updating presentations is not only slow but also prone to bottlenecks, especially when dealing with large volumes of slides. Automation dramatically accelerates this process, enabling designers to apply changes across hundreds of slides in the time it would take to manually update a single one. This efficiency is a game-changer for agencies working under tight deadlines or managing multiple projects simultaneously.

  • - 3 -
    Enhanced Creativity:

    With the burden of manual updates lifted, designers can allocate more time and energy to the creative aspects of presentation design. This freedom allows for deeper exploration of innovative design concepts, experimentation with new visual storytelling techniques, and the development of more engaging and interactive presentations. Automation doesn't stifle creativity; it amplifies it, enabling designers to push the boundaries of what's possible in corporate presentation design.

  • - 4 -
    Error Reduction:

    Manual updates are inherently prone to inconsistencies and mistakes, from misaligned logos to incorrect font sizes. These errors can detract from the professionalism of a presentation and, by extension, the corporate image. Automation minimizes these risks by ensuring that updates are applied uniformly and accurately across all slides, enhancing the overall quality and integrity of the presentation.

  • - 5 -
    Cost-Effectiveness:

    The time savings afforded by automation directly translate to cost savings for both the design agency and its clients. By reducing the hours spent on manual updates, agencies can optimize their workflows and resources, allowing them to take on more projects without compromising on quality. This efficiency can also make high-quality presentation design services more affordable and accessible to a broader range of businesses.

How to Design a Semiconductor Product Infographic

Learn how to design a semiconductor product infographic that transforms complex technical data into clear, compelling visuals for tech audiences.

Semiconductor products represent some of the most complex technology in modern business, combining intricate architectures, nanometer-scale manufacturing processes, and performance metrics that challenge even technical audiences. When you need to communicate chip specifications, process nodes, or system architectures to investors, customers, or internal stakeholders, learning how to design a semiconductor product infographic becomes essential. The right infographic transforms dense technical data into a visual narrative that resonates with decision-makers while maintaining engineering accuracy.

Understanding Your Semiconductor Infographic Audience

The first step in designing an effective semiconductor infographic requires identifying exactly who will consume this information. Technical stakeholders such as engineers and product managers need precision and detail, while executives and investors prioritize business impact and competitive positioning. Your design choices must bridge these different information needs without oversimplifying critical specifications or overwhelming non-technical viewers.

Segmenting Technical Versus Business Viewers

Different audience segments extract different value from semiconductor infographics. Engineers scrutinize transistor counts, power consumption figures, and thermal design parameters. Business leaders focus on market differentiation, total cost of ownership, and time-to-market advantages. When considering how to design a semiconductor product infographic, build information layers that serve both groups simultaneously.

Key audience considerations include:

  • Technical depth required: Determine whether viewers need gate-level detail or system-block overview
  • Domain expertise: Assess familiarity with semiconductor terminology and notation standards
  • Decision authority: Identify who approves purchases, investments, or design wins
  • Time constraints: Recognize that C-suite audiences may spend 30 seconds while engineers study for minutes

Create viewer personas before beginning layout work. Document their questions, pain points, and success metrics. This foundation ensures your infographic addresses real information needs rather than simply displaying available data.

Audience segmentation for semiconductor infographics

Structuring Information Hierarchy for Complex Products

Semiconductor products contain dozens of specifications across multiple categories: performance, power, connectivity, manufacturing, and packaging. Establishing clear information hierarchy prevents cognitive overload and guides viewers through your intended narrative. The MIT Communication Lab's figure-design guidance offers valuable principles for organizing technical information that apply directly to semiconductor infographics.

Building the Primary Message Framework

Every semiconductor infographic needs one dominant message that anchors the entire visual. This might be "30% higher performance per watt than competing solutions" or "first 3nm process node for automotive applications." Secondary information supports this claim through evidence and context.

Structure your hierarchy in three distinct tiers:

  1. Primary message: The single most important takeaway, typically occupying 20-30% of visual space
  2. Supporting evidence: Specifications, benchmarks, or architectural features that validate the primary claim
  3. Contextual details: Manufacturing process, package options, compliance certifications, and availability

Position the primary message in the upper-left quadrant for Western audiences, utilizing the natural F-pattern reading flow. Supporting evidence should follow logical relationships rather than arbitrary groupings. For example, cluster all power-related specifications together rather than scattering them across the layout.

Applying Progressive Disclosure Techniques

Not every viewer needs every specification simultaneously. Progressive disclosure allows you to present overview information immediately while making detailed specifications available through visual cues. Use expandable sections, annotated callouts, or supplementary reference tables positioned at the infographic's periphery.

When explaining how to design a semiconductor product infographic for presentation decks, consider that slides advance sequentially. Your infographic can introduce basic architecture first, then reveal performance metrics, and finally show competitive positioning across three successive slides rather than cramming everything into one overwhelming visual.

Choosing Appropriate Visual Formats for Semiconductor Data

Different semiconductor characteristics demand different visualization approaches. Clock speeds and bandwidth suit line graphs showing progression across generations. Transistor density works well with area charts or proportional squares. Architecture requires block diagrams with hierarchical relationships clearly defined.

Matching Data Types to Chart Forms

Data Category Recommended Visualization Rationale
Performance benchmarks Horizontal bar charts Easy comparison across competitors
Power consumption curves Line graphs with dual axes Shows voltage/frequency relationships
Die architecture Annotated block diagrams Reveals functional unit placement
Process node evolution Timeline or step diagrams Communicates technology roadmap
Market positioning Quadrant charts (Gartner-style) Shows competitive differentiation

Avoid pie charts for semiconductor data. Specifications rarely represent parts of a whole, and pie charts introduce unnecessary cognitive load when comparing similar values. Similarly, 3D charts add visual complexity without improving comprehension for technical audiences who expect engineering precision.

Semiconductor data visualization types

Creating Effective Block Diagrams

Block diagrams form the foundation of semiconductor architecture visualization. Each block represents a functional unit (CPU cores, GPU clusters, memory controllers, I/O interfaces), while connecting lines show data paths and hierarchical relationships. When considering how to design a semiconductor product infographic featuring chip architecture, follow industry-standard notation to maintain credibility with engineering audiences.

Best practices for semiconductor block diagrams:

  • Use consistent block sizing to indicate relative die area or processing capacity
  • Apply directional arrows showing data flow rather than simple connecting lines
  • Label interfaces with industry-standard protocols (PCIe 5.0, DDR5, USB4)
  • Include bandwidth annotations on critical paths
  • Distinguish on-chip versus off-chip components through border styling or shading

The ISA standards for instrumentation symbols provide authoritative guidance for process and system diagrams that semiconductor professionals recognize, particularly when visualizing manufacturing flow or test configurations.

Implementing Technical Accuracy and Standards Compliance

Semiconductor infographics presented to technical audiences must adhere to established notation, units, and measurement standards. Errors in unit prefixes, incorrect power-of-two versus power-of-ten distinctions, or non-standard terminology immediately undermine credibility regardless of visual appeal.

Maintaining Engineering Precision

Use IEEE-approved terminology and abbreviations throughout your infographic. Memory capacity uses binary prefixes (GiB, MiB) while network bandwidth uses decimal prefixes (Gb/s, Mb/s). Clock frequencies appear in GHz or MHz, never "gigahertz per second" or similar constructions that reveal unfamiliarity with semiconductor metrics.

The IEEE Author Center guidance for technical graphics emphasizes resolution requirements and labeling legibility that apply equally to infographics destined for presentations, datasheets, or marketing materials. Ensure all text remains readable when the infographic scales to different display sizes.

Verifying Specification Accuracy

Every number, every claim, and every comparison in your semiconductor infographic requires verification against source documentation. Reference:

  • Official product datasheets and specification sheets
  • Published benchmark results from recognized testing authorities
  • Peer-reviewed technical papers for novel architectures or processes
  • Competitive intelligence verified through multiple independent sources

Build a specification reference table during the design process that links each visual element to its authoritative source. This documentation proves invaluable when stakeholders question particular claims or request additional detail. Professional agencies understand this requirement; businesses looking to hire their first graphic designer should emphasize technical verification skills alongside design capability.

Optimizing Color and Contrast for Technical Communication

Color serves multiple purposes in semiconductor infographics: differentiating functional blocks, encoding performance levels, highlighting competitive advantages, and maintaining brand identity. However, color choices must prioritize accessibility and legibility for audiences that may include colorblind viewers or those viewing printed materials.

Selecting Accessible Color Palettes

Approximately 8% of men and 0.5% of women have some form of color vision deficiency. Your semiconductor infographic must communicate effectively regardless of how viewers perceive color. The W3C guidance on contrast and accessibility establishes minimum contrast ratios that ensure text and important graphical elements remain distinguishable.

Apply these accessibility principles:

  • Achieve minimum 7:1 contrast ratio for body text and critical specifications
  • Never rely solely on color to distinguish between different chip variants or performance tiers
  • Supplement color coding with patterns, textures, or shape variations
  • Test designs using colorblindness simulation tools before finalizing
  • Provide alternative encodings such as labels or icons alongside color differences

The Section 508 guidance on accessible color usage offers practical checklists particularly valuable when designing infographics for government contractors or regulated industries where accessibility compliance carries legal requirements.

Establishing Functional Color Mapping

Semiconductor professionals expect certain color conventions. Heat maps typically progress from blue (cool/low) through yellow to red (hot/high). Power states often use green for active, amber for standby, and red for thermal limits. Architecture diagrams frequently employ blue tones for compute, green for memory, and orange for I/O functions.

When explaining how to design a semiconductor product infographic that resonates with industry veterans, respect these implicit conventions while ensuring your palette remains distinctive enough to reinforce brand identity. Document your color system in a style guide that maintains consistency across multiple infographics and related presentation materials.

Incorporating Brand Identity Without Compromising Clarity

Semiconductor companies invest heavily in brand development, from logo refinement to proprietary color schemes and typography systems. Your infographic must balance brand expression with the functional requirements of technical communication. Overly aggressive branding obscures information; insufficient branding fails to differentiate your product in crowded markets.

Integrating Visual Identity Elements

Apply brand elements strategically rather than uniformly. Reserve your primary brand color for the most important specification or competitive advantage rather than applying it to every block in an architecture diagram. Use brand typography for headlines and callouts while selecting highly legible technical fonts for specification tables and detailed annotations.

Brand Element Primary Application Secondary Application Avoid Using For
Logo Header/footer placement Watermark at 20% opacity Repeated throughout diagram
Brand colors Key differentiators, CTA Section headers, borders All functional blocks
Proprietary fonts Headlines, product names Supporting text if highly legible Dense specification tables
Graphic motifs Backgrounds, dividers Icon accents Critical data visualization

The Carnegie Mellon data visualization guidelines demonstrate how academic institutions balance institutional branding with technical communication requirements, offering useful models for corporate semiconductor visualization.
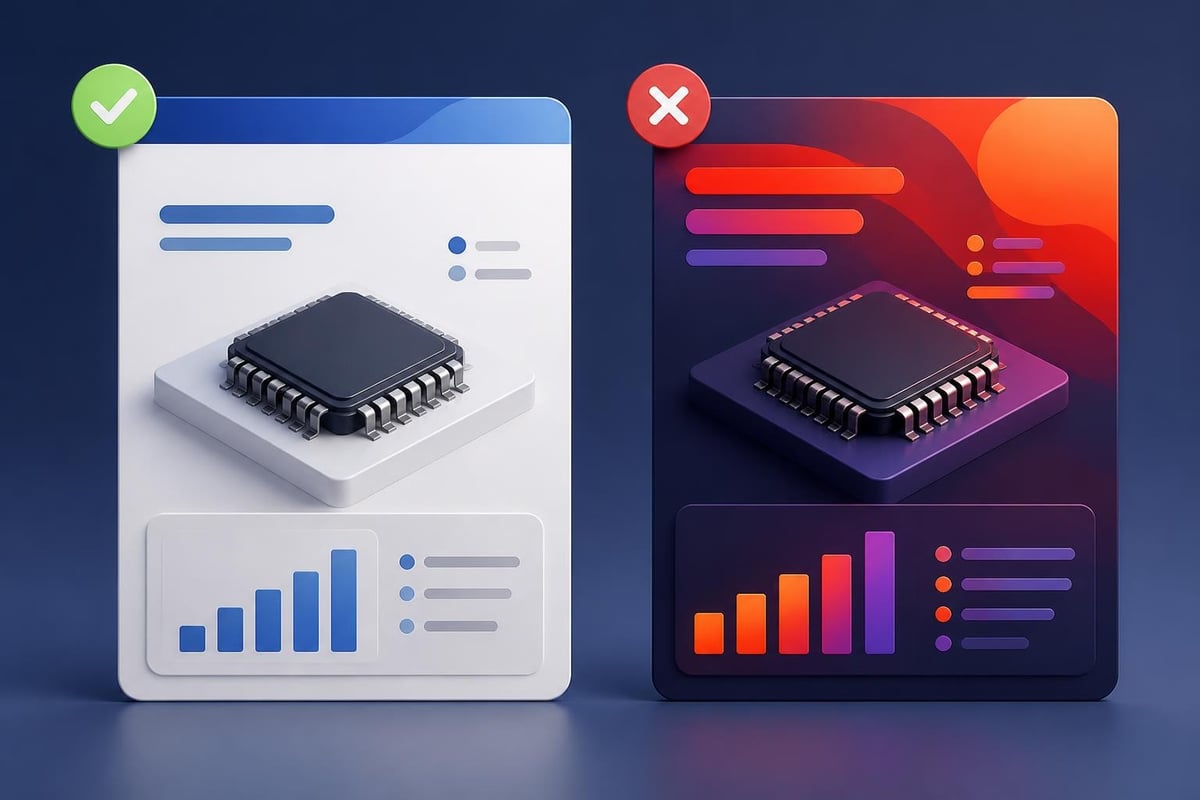
Brand integration in semiconductor infographics

Designing for Multiple Distribution Channels

A semiconductor product infographic rarely serves just one purpose. The same visual might appear in investor pitch decks, on product pages, in sales presentations, at trade show booths, and in technical documentation. Each channel imposes different constraints on dimensions, resolution, file format, and information density.

Adapting Layouts for Different Contexts

Create a master infographic at the highest resolution and detail level required, then develop channel-specific variants rather than attempting a one-size-fits-all approach. Presentation slides demand landscape orientation optimized for 16:9 displays. Datasheets may require portrait orientation with print-friendly dimensions. Social media needs square or vertical formats with enlarged text legible on mobile screens.

When teaching teams how to design a semiconductor product infographic system, establish these format specifications upfront:

  1. Pitch deck version: 1920×1080px landscape, simplified for 30-second comprehension, emphasis on competitive differentiation
  2. Technical datasheet: 8.5×11" portrait, comprehensive specifications, print-optimized at 300 DPI minimum
  3. Trade show poster: 36×48" vertical, maximum visual impact from 10 feet, minimal dense text
  4. Website version: Responsive width, progressive disclosure via hover states or expandable sections
  5. Social media variant: 1080×1080px square, standalone comprehension without surrounding context

Similar to how biotech pitch deck examples demonstrate adaptation across fundraising stages, semiconductor infographics must flex across technical and business contexts while maintaining core messaging consistency.

Optimizing File Formats and Resolution

Technical audiences often zoom into infographics to examine specific details. Vector formats (SVG, AI, PDF) allow infinite scaling without quality loss, making them ideal for architecture diagrams and charts. Raster formats (PNG, JPG) require sufficient resolution to remain legible when magnified but small enough file sizes for web delivery and email distribution.

Export multiple versions:

  • Vector PDF: Master file for print production and high-resolution display
  • High-res PNG (300 DPI): Print-ready raster when vector editing isn't available
  • Web-optimized PNG (72-96 DPI): Balance between quality and load time for digital channels
  • Compressed JPG: Email attachments and content management systems with file size limits

Test exported files on actual target devices and platforms. An infographic that looks crisp on a 27-inch monitor may become illegible on a smartphone or when printed in a proposal document.

Balancing Innovation with Comprehension

Semiconductor technology evolves rapidly, introducing new architectures, packaging techniques, and performance metrics that lack established visualization conventions. When communicating novel concepts, designers face tension between innovative visual approaches that capture attention and familiar formats that ensure immediate comprehension.

Introducing Novel Visual Metaphors Carefully

Cutting-edge semiconductor products may require new visualization approaches. Chiplet architectures benefit from exploded-view 3D renderings showing how individual dies connect. Heterogeneous integration might use layered transparency to reveal stacking configurations. Advanced packaging demands cutaway views exposing internal structures.

Introduce unfamiliar visual formats gradually with supporting annotations that bridge to known concepts. If your chip pioneered a new interconnect technology, show it using standard block-diagram notation first, then reveal the innovative aspect through a detailed callout or supplementary view.

The NCES Forum Guide to Data Visualization emphasizes audience-first design and minimizing jargon, principles that apply when semiconductor infographics address audiences beyond core engineering teams.

Testing Comprehension Before Broad Distribution

Before finalizing a semiconductor infographic for investor presentations or product launches, conduct comprehension testing with representative audience members. Show the infographic for 60 seconds, remove it, then ask viewers to recall the primary message and two supporting details.

Effective infographics achieve 80%+ accuracy on primary message recall and 60%+ on supporting details. Lower performance indicates excessive complexity, unclear hierarchy, or competing visual elements that fragment attention. Iterate based on testing feedback, simplifying or reorganizing until comprehension targets are met.

Annotating Technical Details Effectively

Semiconductor specifications contain nuances that single numbers cannot capture. A "boost clock" of 5.2 GHz means something different depending on thermal conditions, power limits, and workload characteristics. Effective annotation provides essential context without cluttering the primary visual.

Layering Contextual Information

Use these annotation techniques strategically:

  • Asterisks and footnotes: Reference conditions, measurement methodologies, or qualifications
  • Callout boxes: Highlight specific architectural innovations or competitive advantages
  • Hover states (digital): Reveal additional specifications on mouseover without permanently consuming space
  • QR codes (print): Link to detailed specifications, benchmark data, or video explanations
  • Reference numbers: Connect visual elements to comprehensive specification tables

Position annotations near their referenced elements rather than collecting them in a separate legend that forces viewers to repeatedly shift focus. When space constraints prevent direct annotation, use subtle leader lines or numbered indicators that create clear visual connections.

Writing Clear, Concise Labels

Every label in a semiconductor infographic competes for limited attention. Write labels that communicate precisely without unnecessary words. "8-Core CPU Cluster" conveys the same information as "Central Processing Unit with Eight Independent Cores" in one-third the space.

Abbreviate according to industry standards but define uncommon acronyms on first use. While semiconductor engineers immediately recognize "FOVEROS" or "CoWoS" as Intel and TSMC advanced packaging brands respectively, business audiences may not. Brief parenthetical expansions ("FOVEROS (3D die stacking)") bridge knowledge gaps without patronizing technical viewers.

Leveraging Professional Design Resources

Complex semiconductor infographics demand expertise beyond basic presentation software. While platforms offer starting points, sophisticated visualizations require professional design tools and technical illustration skills. Understanding when to engage specialists versus handling projects internally significantly impacts both quality and efficiency.

Recognizing When to Engage Design Specialists

Simple specification comparisons or basic architecture diagrams may suit internal development using standard templates. However, investor-facing materials, product launch infographics, or technically complex visualizations benefit from professional design expertise. Agencies like Prznt Perfect specialize in transforming technical complexity into compelling visual narratives that resonate with both technical and business audiences.

Consider professional design services when:

  • Infographics will influence major investment or purchasing decisions
  • Products introduce novel technologies requiring custom visualization approaches
  • Deadlines are tight and internal resources lack capacity
  • Multiple variants are needed across diverse distribution channels
  • Brand consistency across extensive marketing materials is critical

The investment in professional design typically returns multiples through improved deal closure rates, reduced sales cycle length, and enhanced market positioning versus competitors using generic visualization approaches.

Building Internal Capability Strategically

Organizations producing frequent semiconductor infographics benefit from developing internal design capability while engaging specialists for flagship projects. Train technical marketing staff in fundamental visualization principles, establish template libraries for common diagram types, and create style guides ensuring consistency.

The visualization research on communication guidelines offers academic rigor useful when building institutional knowledge around technical visualization. Combine such research-backed principles with practical experience to elevate internal team capabilities over time.

Measuring Infographic Effectiveness

Unlike presentation decks where engagement metrics come from pitch outcomes, standalone infographics require different effectiveness measures. Track how semiconductor product infographics contribute to broader marketing and sales objectives through both quantitative metrics and qualitative feedback.

Establishing Performance Indicators

Define success metrics before deploying infographics across channels:

  • Engagement duration: Time spent viewing digital infographics (target: 90+ seconds for comprehensive designs)
  • Download rates: How frequently technical documentation including infographics gets saved
  • Sales cycle impact: Changes in time-to-close for opportunities supported by new infographics
  • Competitive win rates: Percentage of competitive evaluations won when infographics are presented
  • Support ticket reduction: Decreased technical inquiries about specifications after infographic deployment

Digital distribution enables detailed analytics. Monitor scroll depth, zoom interactions, and clickthrough rates on linked specifications. A/B test alternative layouts, color schemes, or information hierarchies to optimize performance empirically rather than relying solely on design intuition.

Gathering Stakeholder Feedback

Quantitative metrics reveal engagement patterns but not comprehension quality. Supplement analytics with structured feedback from sales teams, customers, and technical evaluators. Ask specific questions:

  1. What primary message did you take from this infographic?
  2. Which specifications or features stood out most prominently?
  3. What additional information would have been valuable?
  4. How did this visualization compare to competitor materials?
  5. Would you share this infographic with colleagues or decision-makers?

Iterate based on patterns in responses. If multiple viewers mention confusion about the same element, redesign that component. If a particular feature consistently goes unnoticed despite its importance, increase its visual prominence or introduce directional cues guiding attention.


Mastering how to design a semiconductor product infographic transforms complex technical specifications into strategic communication assets that accelerate deals, educate stakeholders, and differentiate products in competitive markets. The principles of audience segmentation, information hierarchy, visual format selection, technical accuracy, accessible design, and multi-channel optimization combine to create infographics that serve both engineering precision and business impact. Whether you're developing internal capabilities or seeking expert support, Prznt Perfect brings deep expertise in translating technical complexity into compelling visual narratives that resonate with financial and technology audiences, helping your semiconductor innovations achieve the market recognition they deserve.


News & Updates...

How to make financial presentations exciting without softening the numbers: structure, chart choices, wording and delivery that hold a room's attention.

Expert insights on semiconductor pitch deck design agency services. Learn how specialized presentation design transforms complex chip technology into investor-ready narratives.