
Biotech Presentation Design: Expert Guide for 2026
Biotechnology companies face a unique challenge when presenting their science to diverse audiences ranging from venture capitalists to regulatory agencies to strategic partners. The complexity of genomic data, clinical trial results, and molecular mechanisms demands a specialized approach to visual communication. Effective biotech presentation design bridges the gap between scientific rigor and business clarity, transforming intricate research findings into compelling narratives that drive funding decisions, partnership agreements, and regulatory approvals. In 2026, as the biotech sector continues its rapid expansion with breakthrough therapies and diagnostic platforms, the ability to communicate complex science visually has never been more critical for company success.
Understanding the Unique Challenges of Biotech Presentations
Biotech presentations require balancing scientific accuracy with accessibility. Your audience often includes both technical experts and business professionals who need different levels of detail.
The primary challenge lies in data density. Clinical trial endpoints, mechanism of action diagrams, competitive landscape analyses, and financial projections must coexist within limited slide real estate. Best practices for delivering complex scientific information emphasize structuring content into digestible sections that build progressively rather than overwhelming viewers with everything at once.
Key Audience Considerations
Different stakeholders require tailored approaches:
- Investors prioritize market opportunity, competitive advantages, and financial returns
- Scientific advisory boards demand technical depth and methodological rigor
- Regulatory bodies focus on safety data, manufacturing processes, and compliance
- Business development partners seek strategic fit and commercial potential
Understanding these varied needs shapes every design decision in biotech presentation design. A Series A pitch deck differs dramatically from an FDA advisory committee presentation, yet both must maintain scientific credibility while achieving their specific objectives.

Visual Storytelling for Scientific Data
Effective biotech presentation design transforms raw data into visual narratives that guide audiences through complex information landscapes. Rather than displaying spreadsheets of clinical results, strategic visualization highlights patterns, trends, and significance.
Data visualization principles for biotech include:
- Simplifying molecular mechanisms through progressive disclosure
- Using consistent color coding across related data sets
- Highlighting statistical significance with strategic emphasis
- Comparing results against benchmarks or competitors
- Showing progression over time for longitudinal studies
The importance of incorporating visuals in biotech presentations cannot be overstated. Visual elements simplify complex data and enhance audience retention, particularly when presenting pharmacokinetic curves, biomarker expression levels, or patient stratification schemas.
Creating Effective Scientific Diagrams
Mechanism of action slides represent one of the most challenging aspects of biotech presentation design. These diagrams must accurately depict biological processes while remaining comprehensible to non-specialists.
| Diagram Type | Best Practice | Common Mistake |
|---|---|---|
| Pathway diagrams | Use directional arrows and clear labeling | Overcrowding with minor proteins |
| Clinical endpoints | Show primary vs. secondary clearly | Mixing multiple trials without context |
| Patient journey | Linear timeline with key milestones | Undefined medical terminology |
| Competitive landscape | Position by clear differentiation axes | Too many competitors without focus |
Professional PowerPoint design techniques ensure these complex diagrams maintain visual hierarchy and guide viewer attention to critical insights rather than peripheral details.
Structuring Content for Maximum Impact
Biotech presentation design requires intentional information architecture. The sequence of slides should mirror the logical progression of your scientific story, building credibility before making ambitious claims.
A typical biotech investor presentation follows this structure:
- Problem statement: Unmet medical need with market quantification
- Solution overview: Your therapeutic approach or platform technology
- Scientific validation: Preclinical data, mechanism of action
- Clinical evidence: Trial design, results, upcoming milestones
- Competitive positioning: Differentiation and intellectual property
- Business model: Revenue strategy, pricing, reimbursement
- Team credentials: Key opinion leaders, management experience
- Financial projections: Funding needs, use of proceeds, exit potential
Each section serves a specific purpose in building the investment thesis. Insights on biotech pitch decks reveal that successful presentations allocate slide count proportionally to audience priorities rather than scientific complexity.
Progressive Disclosure Techniques
Complex biotech concepts benefit from revealing information in stages. Rather than presenting a complete pathway diagram immediately, introduce the disease state, then your target, then the intervention mechanism.
This approach applies to clinical data as well. Show overall efficacy first, then safety profile, then subgroup analyses for interested parties. Keep detailed data in appendix slides for technical questions during Q&A sessions.

Design Principles for Scientific Credibility
Visual design choices signal professionalism and trustworthiness. In biotech presentation design, every element from color palette to font selection contributes to perceived credibility.
Core design principles include:
- Consistency: Uniform styling across all slides reinforces brand professionalism
- Clarity: White space prevents cognitive overload from dense scientific content
- Hierarchy: Size and weight differences guide attention to key findings
- Accuracy: Precise data representation without misleading visualizations
- Accessibility: Readable fonts and colorblind-friendly palettes
The comprehensive best practices from RSNA provide detailed guidance on visual elements, color usage, and font selection that translates effectively to biotech contexts.
Color Strategy in Scientific Presentations
Color serves both aesthetic and functional purposes. In biotech presentation design, strategic color use helps differentiate data series, highlight significant results, and maintain brand identity.
Best practices for color implementation:
- Use brand colors for company-related elements (logo, section dividers, your product)
- Apply neutral colors (grays, blues) for background data and context
- Reserve high-contrast colors (red, orange) for highlighting critical findings
- Maintain consistency across related charts (same color for same variable)
- Test presentations for colorblind accessibility using simulation tools
Avoid overly vibrant or neon colors that undermine scientific seriousness. Pastels and muted tones convey professionalism while maintaining visual interest.
Transforming Complex Data Into Clear Narratives
The essence of effective biotech presentation design lies in translation. Raw scientific data must become accessible insights without losing technical accuracy.
Clinical Trial Results Presentation
Presenting clinical outcomes requires careful consideration of statistical rigor and business implications. Rather than showing every measured endpoint, focus on outcomes that matter to your audience.
For investor presentations, emphasize:
- Primary endpoint achievement with statistical significance
- Safety profile comparison to standard of care
- Durability of response over time
- Patient-reported outcomes when relevant
- Subgroup analyses that expand market opportunity
For regulatory submissions, include:
- Detailed inclusion/exclusion criteria
- Complete adverse event profiles
- Protocol deviations and their management
- Statistical analysis plans
- Quality of life assessments
Designing high-impact scientific presentations requires understanding which data points drive decisions for each audience type, then designing slides that make those insights immediately apparent.
Layout and Composition Strategies
Effective PowerPoint layout design creates visual flow that guides audiences through complex information systematically. In biotech presentation design, layout decisions determine whether viewers grasp your science or become confused.
Layout strategies for different slide types:
| Slide Purpose | Optimal Layout | Key Elements |
|---|---|---|
| Title slides | Centered, minimal text | Company logo, presentation title, date |
| Data charts | 2/3 visual, 1/3 interpretation | Large graph, key takeaway statement |
| Mechanisms | Full-slide diagram | Clear labels, directional flow, legend |
| Timelines | Horizontal flow | Past achievements, current position, future milestones |
| Team slides | Grid or rows | Headshots, names, credentials, relevant experience |
Maintain consistent margins and alignment across all slides. Inconsistent spacing signals carelessness that undermines scientific credibility.
The Power of White Space
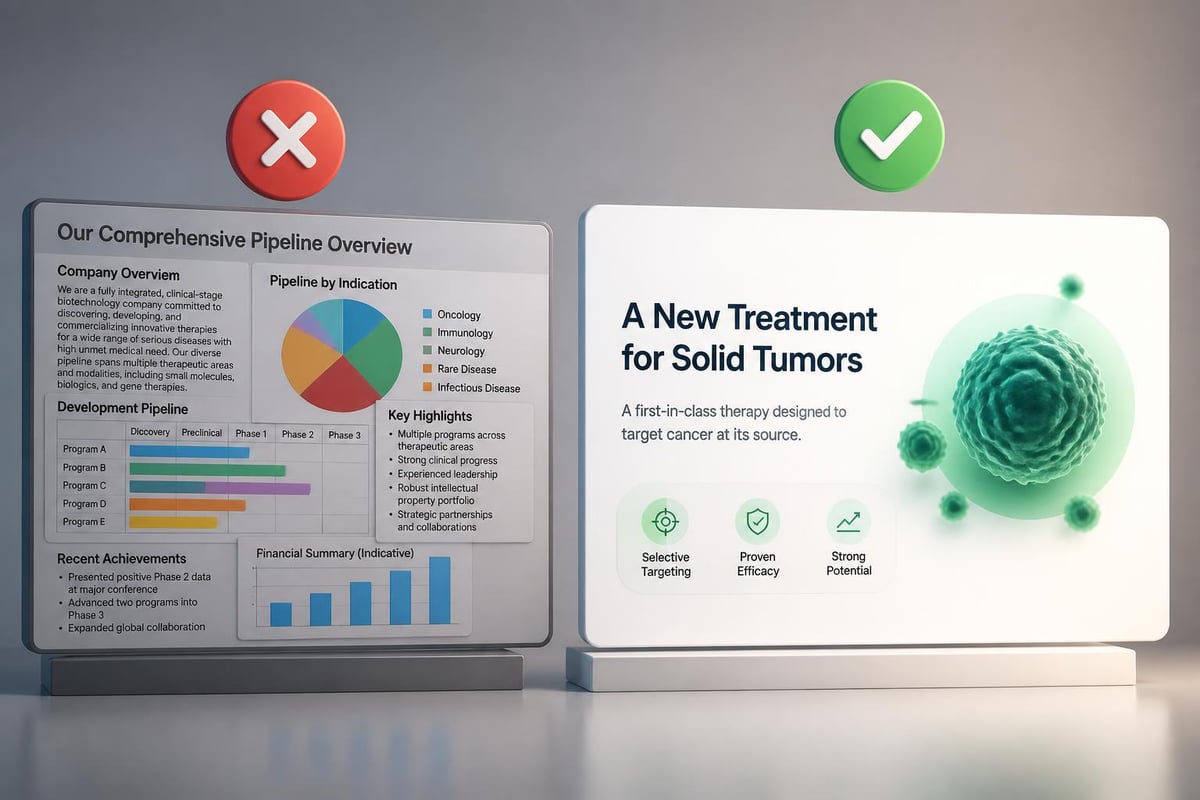
Scientific presenters often attempt to maximize information density, filling every pixel with data. This approach backfires by overwhelming audiences and obscuring key messages.
Strategic white space enhances comprehension. Leave breathing room around charts, separate distinct concepts with space rather than lines, and resist the urge to shrink fonts to fit more content. If information does not fit comfortably, it belongs on a separate slide or in the appendix.
Typography for Technical Content
Font selection impacts readability and professionalism in biotech presentation design. Scientific presentations often include specialized terminology, chemical formulas, and numerical data that demand careful typographic treatment.
Typography best practices:
- Use sans-serif fonts (Arial, Calibri, Helvetica) for body text and labels
- Reserve serif fonts (Georgia, Times) for print materials if needed
- Maintain minimum 18-point font size for body text
- Use 28-point or larger for slide titles
- Limit italics to scientific names and gene nomenclature
Avoid decorative or script fonts entirely. They compromise readability and undermine scientific authority. Consistency matters more than creativity in font selection.
Formatting Scientific Notation
Chemical formulas, gene names, and mathematical expressions require special formatting attention. Subscripts, superscripts, and specialized characters must render clearly at presentation scale.
Best practices include:
- Testing all specialized notation at actual presentation size
- Using equation editors for complex formulas rather than typed approximations
- Defining abbreviations on first use or in a glossary slide
- Maintaining consistent formatting for recurring terms throughout the deck
These details separate professional biotech presentation design from amateur efforts that damage credibility through formatting inconsistencies.
Leveraging Technology and Tools
Modern presentation software offers sophisticated capabilities for biotech presentation design. Understanding available tools enables more effective data visualization and audience engagement.
Essential tools for biotech presentations:
- Advanced charting: Excel integration for dynamic data visualization
- Animation: Strategic reveals for complex diagrams (use sparingly)
- Multimedia: Video clips of mechanism of action or patient testimonials
- Interactive elements: Embedded calculators or clickable pathways for detailed reviews
- Collaboration platforms: Cloud-based editing for distributed scientific teams
For companies seeking to optimize their content strategy alongside presentation design, platforms like RankPill provide AI-powered SEO solutions that help biotech firms enhance their digital presence and reach target audiences more effectively.
Presentation File Management
Biotech presentations evolve continuously as new data emerges. Implement version control systems to track changes, maintain master templates for consistency, and create modular slide libraries for different presentation contexts.
File naming conventions should include date, version number, and presentation type (e.g., "CompanyName_SeriesB_Pitch_2026-05-16_v3.pptx"). This organizational discipline prevents presenting outdated data or incorrect versions.
Adapting Presentations for Different Venues
The same scientific story requires different execution depending on presentation context. A boardroom pitch to three partners differs from a conference presentation to 300 attendees.
Virtual Presentation Considerations
Remote presentations demand enhanced visual clarity since you cannot read audience body language or adjust pacing dynamically. For virtual biotech presentation design:
- Increase font sizes by 2-4 points above in-person standards
- Use high-contrast color schemes that render well on various screens
- Embed video content rather than relying on screen sharing
- Create dedicated Q&A slides for common technical questions
- Test all multimedia elements across platforms (Zoom, Teams, WebEx)
Virtual fatigue is real. Keep virtual presentations 20-30% shorter than equivalent in-person sessions, with more frequent transition points to maintain engagement.
Conference and Scientific Meeting Formats
Academic conferences follow strict formatting requirements. Review presentation guidelines carefully regarding:
- Slide dimensions (16:9 vs. 4:3 aspect ratios)
- File format requirements (PowerPoint, PDF, both)
- Disclosure slide requirements for conflicts of interest
- Logo placement restrictions
- Reference citation formatting expectations
Scientific presentation design for conferences emphasizes visual storytelling and effective use of visuals to engage diverse scientific audiences within tight time constraints.
Communicating with Non-Scientific Audiences
Biotech companies must frequently present to audiences without scientific backgrounds. Investors, media, patient advocacy groups, and general business partners require different communication approaches than scientific peer reviewers.
Presenting biotech concepts to non-scientists involves strategic simplification without condescension. Analogies, everyday language, and focus on outcomes rather than mechanisms help bridge knowledge gaps.
Techniques for non-scientific audiences:
- Replace technical jargon with plain language equivalents
- Use analogies that connect to familiar concepts
- Focus on patient benefits rather than molecular details
- Quantify market opportunity in clear financial terms
- Show the problem visually before introducing your solution
This does not mean eliminating science entirely. Include sufficient technical detail to demonstrate credibility, but make it accessible through progressive disclosure and clear visual support.
Milestone Visualization Strategies
Product development timelines communicate progress and future value creation. Highlighting milestones on biotech product launch slides requires clear timeline structures and strategic design emphasis.
Effective milestone presentations include:
- Past achievements: Completed preclinical work, Phase 1 results, manufacturing scale-up
- Current status: Ongoing trials, regulatory interactions, partnership discussions
- Near-term catalysts: Expected data readouts, regulatory submissions, commercial launches
- Long-term vision: Pipeline expansion, indication additions, platform applications
Visual timeline formats vary from horizontal swimlanes to vertical roadmaps to circular diagrams. Choose formats that make temporal relationships clear while maintaining visual interest.
De-Risking Narratives
Investors evaluate biotech opportunities through a risk lens. Your milestone presentation should demonstrate systematic risk reduction over time as you achieve technical, regulatory, and commercial validation.
Use color coding to show:
- Completed milestones (green): De-risked elements
- In-progress milestones (yellow): Current focus areas
- Future milestones (blue): Planned validation points
- Optional milestones (gray): Contingent expansion opportunities
This visual risk framework helps investors understand value inflection points and capital efficiency.
Maintaining Brand Consistency Across Presentations
Biotech companies often create multiple presentation versions for different audiences and purposes. Maintaining brand consistency across this presentation portfolio reinforces professional identity and builds recognition.
Develop comprehensive brand guidelines covering:
- Logo usage and clearance space requirements
- Primary and secondary color palettes with RGB/CMYK values
- Typography specifications including font families and size hierarchies
- Icon and illustration styles for scientific diagrams
- Photography or imagery guidelines for team and facility photos
- Data visualization color schemes and chart styles
These guidelines ensure that whether someone sees your Series A pitch, scientific poster, or partnership overview, they encounter consistent visual branding that reinforces your company identity.
Appendix Strategy for Technical Depth
Every biotech presentation benefits from a comprehensive appendix section containing detailed information that supports your main narrative without cluttering primary slides.
Essential appendix content:
- Detailed clinical trial designs and protocols
- Complete adverse event tables
- Manufacturing process diagrams
- Intellectual property landscapes
- Detailed competitive analysis matrices
- Team member full CVs and publications
- Financial model assumptions and sensitivity analyses
Number appendix slides separately (A-1, A-2, etc.) to distinguish them from main content. Reference appendix slides during your presentation when appropriate ("detailed mechanism appears in appendix slide A-7"), allowing interested parties to explore further during Q&A or offline review.
Quality Control and Review Processes
Professional biotech presentation design requires rigorous review before high-stakes presentations. Errors in data, typos in slide text, or formatting inconsistencies undermine credibility and raise questions about scientific rigor.
Implement a multi-stage review process:
- Scientific review: Technical accuracy of data, claims, and mechanisms
- Business review: Market sizing, competitive positioning, financial projections
- Legal review: IP claims, regulatory statements, disclosure requirements
- Design review: Visual consistency, branding compliance, accessibility
- Proofreading: Grammar, spelling, formatting, version control
Build sufficient review time into presentation development schedules. Rushing through quality control to meet deadlines creates risks that far outweigh any scheduling benefits.
Testing Presentations in Context
Present to internal teams in conditions matching the actual venue. Practice with the same equipment, lighting, and screen setup when possible. This reveals readability issues, timing problems, and technical glitches before they impact critical presentations.
Record practice sessions and review objectively. Are key messages clear? Does pacing allow absorption of complex data? Do transitions flow logically? Identify improvement opportunities while you still have time to refine.
Mastering biotech presentation design requires balancing scientific accuracy with visual clarity, technical depth with accessibility, and comprehensive data with focused messaging. By implementing these strategies-from progressive disclosure and strategic color use to audience-specific adaptations and rigorous quality control-biotech companies can transform complex science into compelling narratives that drive funding, partnerships, and regulatory success. When you need expert support in crafting presentations that resonate with investors and stakeholders while maintaining scientific credibility, Prznt Perfect brings specialized expertise in transforming complex biotech concepts into visually stunning, strategically designed presentations that achieve your business objectives.


- This is some text inside of a div block.lay out the facts clearly and compellingly. Use data to establish the ground reality, but remember that facts alone are like the individual strands of a tapestry—necessary but not complete.lay out the facts clearly and compellingly. Use data to establish the ground reality, but remember that facts alone are like the individual strands of a tapestry—necessary but not complete.
- This is some text inside of a div block.lay out the facts clearly and compellingly. Use data to establish the ground reality, but remember that facts alone are like the individual strands of a tapestry—necessary but not complete.

